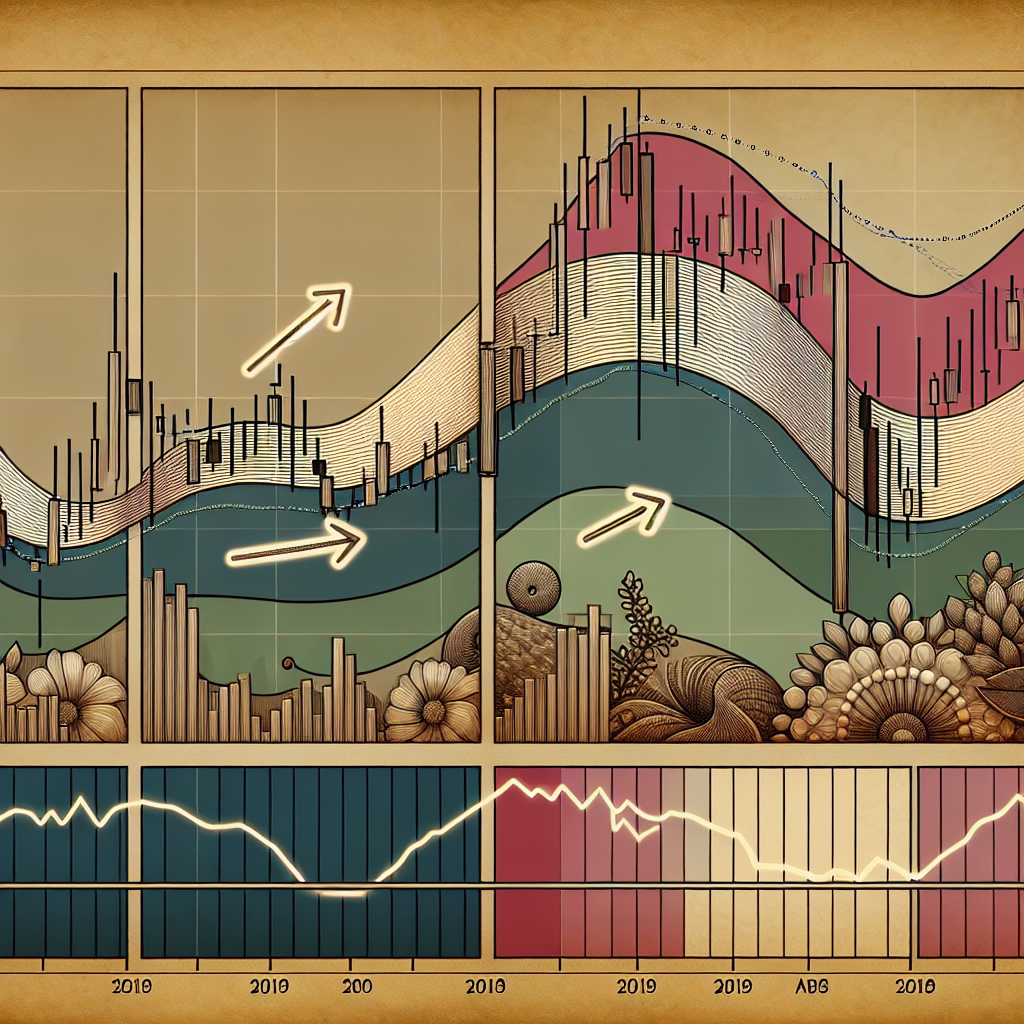
Introduction to RSI and Market Momentum
The Relative Strength Index (RSI) is a powerful tool utilized by traders and investors to gauge the momentum of a particular market. Developed by J. Welles Wilder, RSI is a momentum oscillator that measures the speed and change of price movements. It is primarily used to identify overbought or oversold conditions in a market, but it can also be a useful tool for identifying market momentum.
Understanding RSI
The RSI ranges from 0 to 100 and is typically plotted on a graph alongside the price of a security. An RSI of 70 or above generally indicates an overbought or overvalued condition, suggesting that a price correction may be imminent. Conversely, an RSI of 30 or below usually signifies an oversold or undervalued condition, indicating a potential price increase.
Calculating RSI
The RSI is calculated using the formula: RSI = 100 – (100 / (1 + RS)), where RS represents the average gain of up periods during the specified time frame divided by the average loss of down periods. This formula results in a value between 0 and 100, which is then plotted on a chart to help traders and investors identify potential buying or selling opportunities.
Using RSI to Identify Market Momentum
While RSI is traditionally used to identify overbought and oversold conditions, it can also be an effective tool for identifying market momentum. When RSI moves above 50, it indicates that gains are outpacing losses—a sign of positive momentum or bullish conditions. Conversely, when RSI falls below 50, it suggests that losses are outpacing gains, indicating negative momentum or bearish conditions.
RSI Divergences
Divergences between price and RSI can also signal changes in market momentum. For instance, if the price of a security is making higher highs while RSI is making lower highs, this could indicate a loss of momentum and a potential price reversal. Conversely, if the price is making lower lows while RSI is making higher lows, this could signal increasing momentum and a potential price increase.
RSI Swing Failures
Another way to use RSI to identify market momentum is through swing failures. A swing failure occurs when RSI breaks above 70, falls back below it, and then fails to reach 70 on the next rally. This can be a sign that momentum is waning and a price reversal may be imminent.
Conclusion
In conclusion, while the Relative Strength Index is traditionally used to identify overbought and oversold conditions, it can also be a powerful tool for identifying market momentum. By understanding how to interpret RSI divergences and swing failures, traders and investors can gain valuable insights into the strength and direction of market trends. As with any technical analysis tool, however, RSI should not be used in isolation, but rather in conjunction with other indicators and analysis methods to increase the probability of successful trading outcomes.


