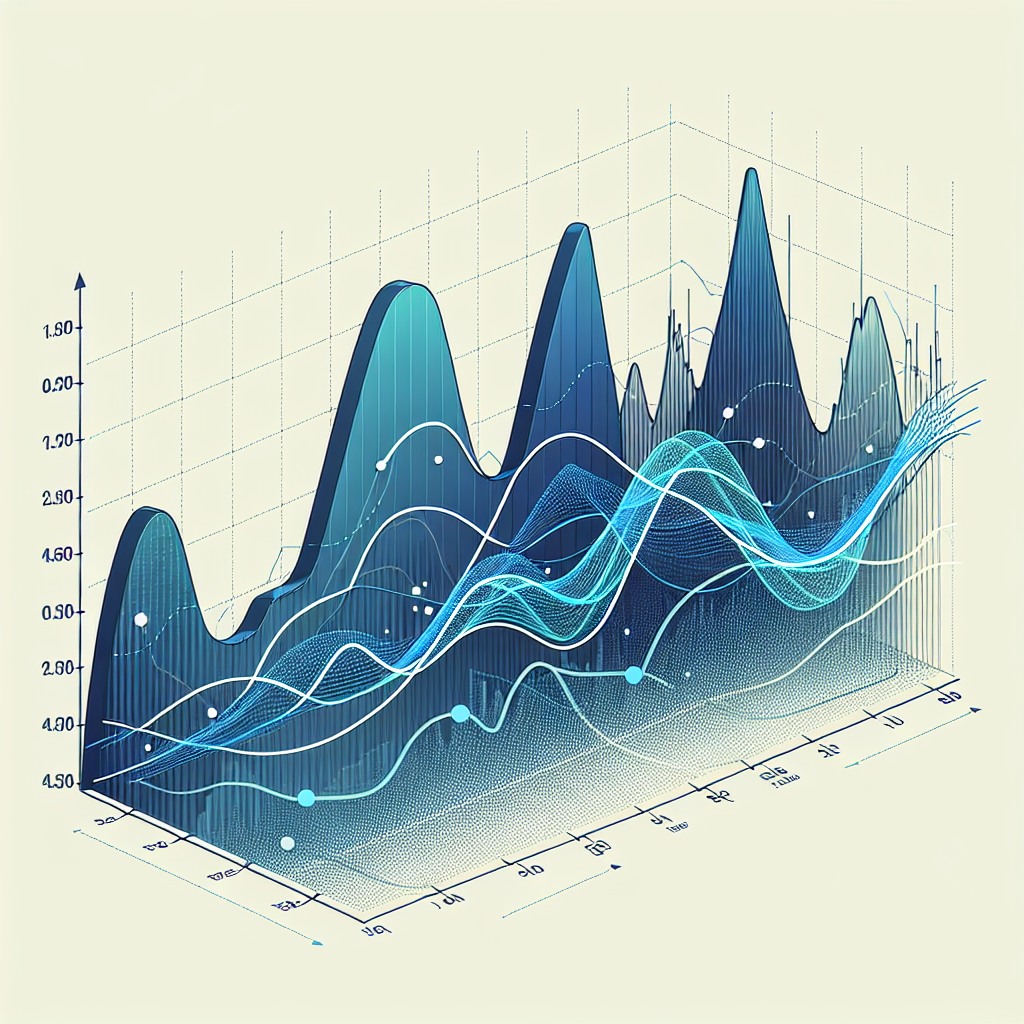
Introduction to Trend Analysis
Trend analysis is a technique used in technical analysis that attempts to predict the future stock price movements based on recently observed trend data. It involves evaluating historical data or chart patterns to predict how the price will move based on the data that is currently available.
Understanding Moving Averages
Moving averages are a cornerstone of technical analysis. They help to smooth out price data by creating a constantly updated average price. The average is taken over a specific period of time, like 10 days, 20 minutes, 30 weeks, or any time period the trader chooses.
There are two types of moving averages most commonly used in forex trading: the simple moving average (SMA), and the exponential moving average (EMA). SMA calculates the average of a selected range of prices, usually closing prices, by the number of days in that range. EMA applies more weight to data that is more current.
How to Use Moving Averages for Trend Analysis
Step 1: Select the Time Period
The first step in applying the moving average method for trend analysis is to select the time period over which the average will be calculated. The time period chosen will depend on the type of trend you are interested in analyzing. For short-term trends, a shorter time period may be appropriate, while for long-term trends, a longer time period may be more suitable.
Step 2: Calculate the Moving Average
The next step is to calculate the moving average. This is done by adding up the closing prices for the selected time period and then dividing by the number of periods. For example, if you are using a 10-day moving average, you would add up the closing prices for the last 10 days and then divide by 10.
Step 3: Plot the Moving Average
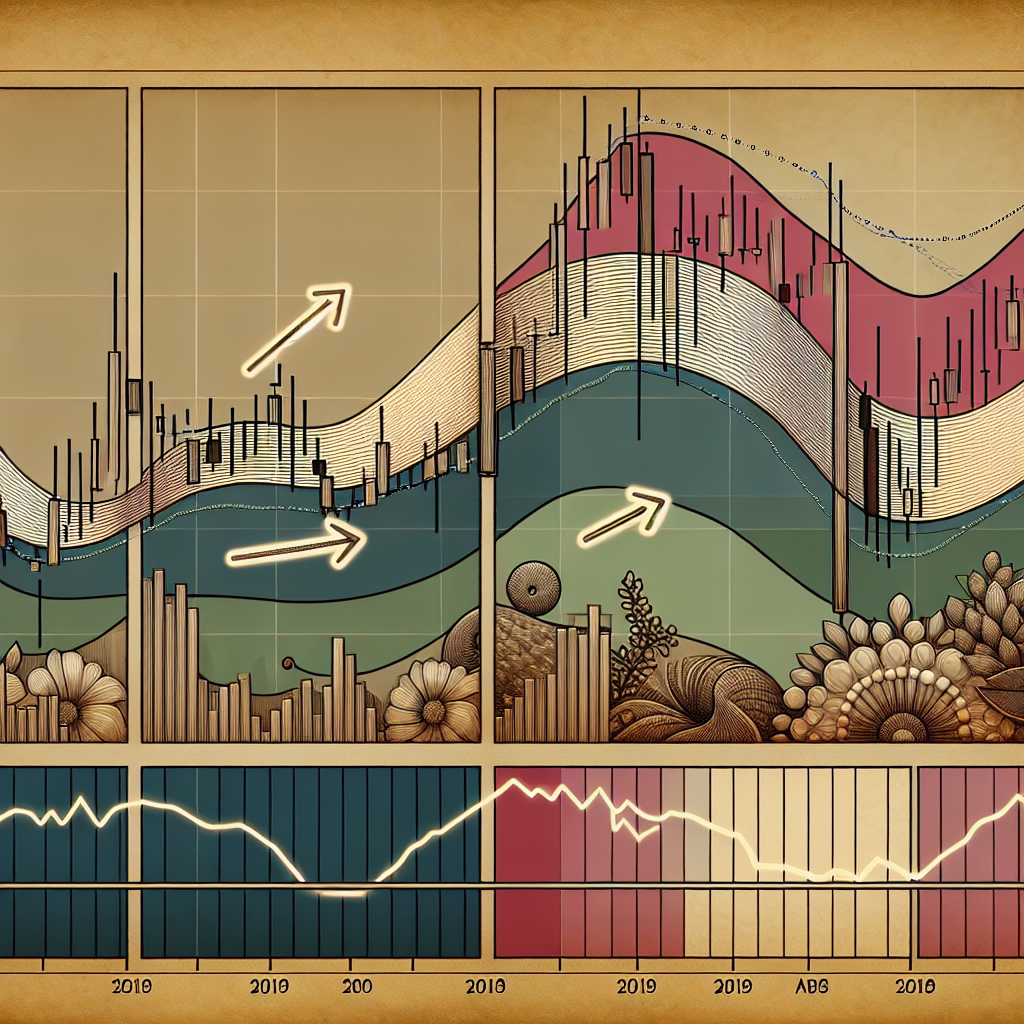
Once the moving average has been calculated, it can be plotted on a chart alongside the actual price data. This provides a visual representation of the trend and can help to identify patterns and potential future price movements.
Step 4: Interpret the Results
The final step is to interpret the results. If the price is above the moving average, this typically indicates an upward trend, while if the price is below the moving average, this suggests a downward trend. The moving average can also be used to identify potential support and resistance levels.
Advantages and Disadvantages of Using Moving Averages
Moving averages are widely used because they are simple to calculate, easy to understand, and can provide a useful snapshot of the market trend. However, they are not without their disadvantages. Because they are based on past data, moving averages can be lagging indicators, meaning they may not accurately reflect current market conditions. Additionally, they may not be effective in markets that are not trending.
Conclusion
Despite the potential limitations, moving averages are a useful tool for trend analysis in the financial markets. They can provide a simple and effective way to identify and analyze market trends, making them an invaluable tool for traders and investors alike. However, as with any technical analysis tool, they should be used in conjunction with other indicators and methods to increase the accuracy of predictions and reduce the risk of false signals.


