Introduction to MACD
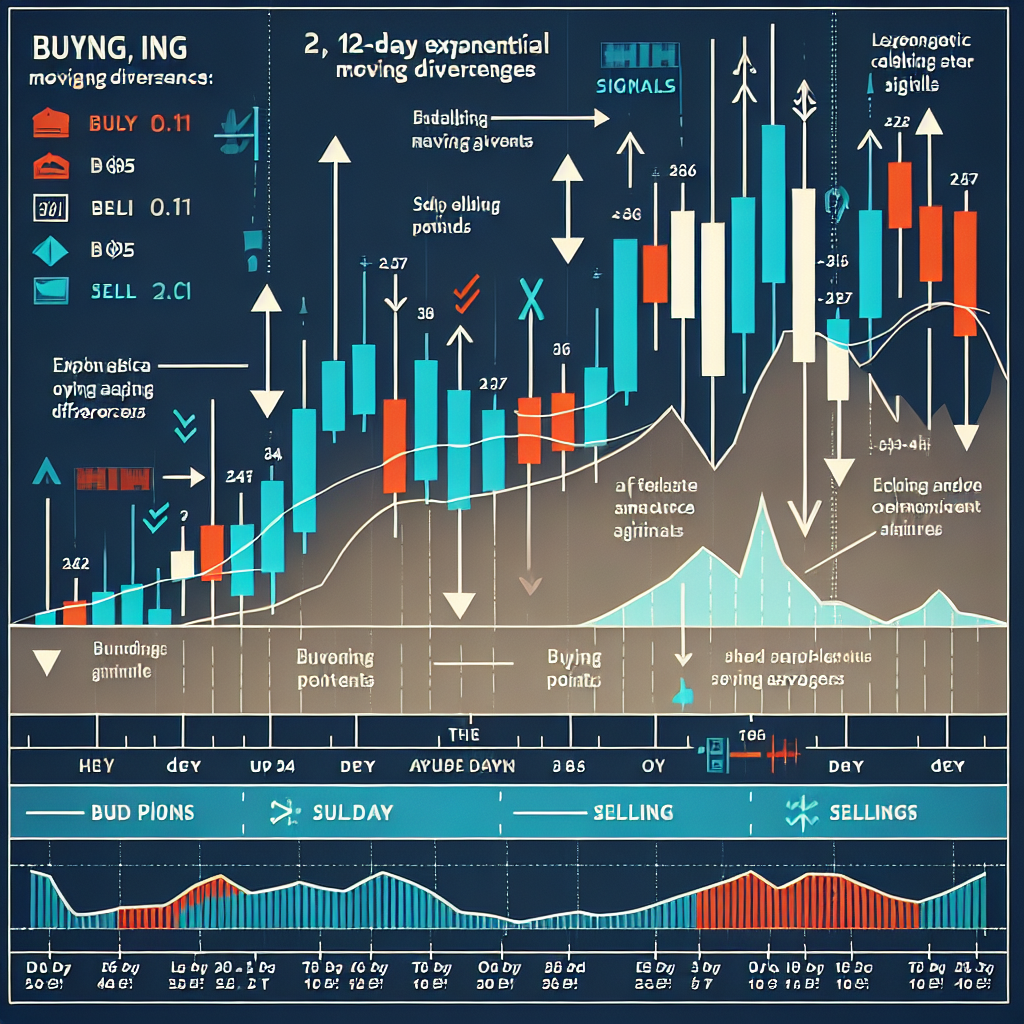
The Moving Average Convergence Divergence (MACD) is a trend-following momentum indicator that reveals the connection between two moving averages of a security’s price. The MACD is computed by subtracting the 26-day Exponential Moving Average (EMA) from the 12-day EMA. A nine-day EMA of the MACD, known as the “signal line,” is then plotted on top of the MACD, functioning as a trigger for buy and sell signals.
Using MACD for Trade Signals
Traders can use the MACD to identify potential buy and sell signals. When the MACD crosses above the signal line, it gives a bullish signal, indicating that it might be a good time to buy. Conversely, when the MACD crosses below the signal line, it provides a bearish signal, suggesting that it might be a good time to sell.
Step 1: Understanding MACD Lines
The MACD indicator comprises two lines: the MACD line and the signal line. The MACD line is the faster line, while the signal line is the slower line. When the MACD line crosses above the signal line, it is a bullish signal, and when it crosses below, it is a bearish signal.
Step 2: Identifying the Signal Line Crossovers
The primary method of interpreting the MACD is with signal line crossovers. When the MACD falls below the signal line, it is a bearish signal, which indicates that it may be time to sell. Conversely, when the MACD rises above the signal line, the indicator gives a bullish signal, which suggests that the price of the asset is likely to experience upward momentum.
Step 3: Recognizing Divergences
Another way to use the MACD is to look for a divergence between the price of the asset and the MACD. If the price of the asset is making higher highs, but the MACD is making lower highs, this is called a bearish divergence, and it could be a sign that upward momentum is slowing. On the other hand, if the price is making lower lows, but the MACD is making higher lows, this is a bullish divergence, which could indicate that downward momentum is slowing.
Step 4: Analyzing the Zero Line Crossovers
Zero line crossovers are another signal that traders can use. When the MACD crosses above the zero line, it is a bullish signal, indicating that it may be a good time to buy. Conversely, when the MACD crosses below the zero line, it is a bearish signal, suggesting that it may be a good time to sell.
Conclusion
The MACD is a versatile tool that can be used in a variety of ways. Traders can use it to identify potential buy and sell signals, to recognize divergences, and to analyze zero line crossovers. However, like all technical indicators, it should not be used in isolation. Traders should use the MACD in conjunction with other technical analysis tools and indicators to increase the chances of success.


