Using Moving Averages for Trend Analysis
Introduction to Moving Averages
Moving averages are a fundamental aspect of technical analysis, often used to identify trends in various markets. This statistical technique involves the calculation of a series of averages of different subsets of the full data set. It is called a moving average because as new data is added, the oldest data is dropped, and the average ‘moves’ over time. In the world of finance, moving averages are primarily used to generate trading signals and determine the direction of market trends.
Types of Moving Averages
There are several types of moving averages that differ in their calculation methods and sensitivity to price changes. The two most common types are the Simple Moving Average (SMA) and the Exponential Moving Average (EMA).
Simple Moving Average (SMA)
The Simple Moving Average is the simplest form of a moving average. It is calculated by adding up the prices of an asset over a certain number of periods and then dividing by that number of periods. The SMA gives equal weight to all prices within the period.
Exponential Moving Average (EMA)
The Exponential Moving Average, on the other hand, gives more weight to recent prices. This means that it is more responsive to recent price changes. The EMA is calculated by adding a percentage of the current price to a percentage of the previous day’s EMA.
Using Moving Averages for Trend Analysis
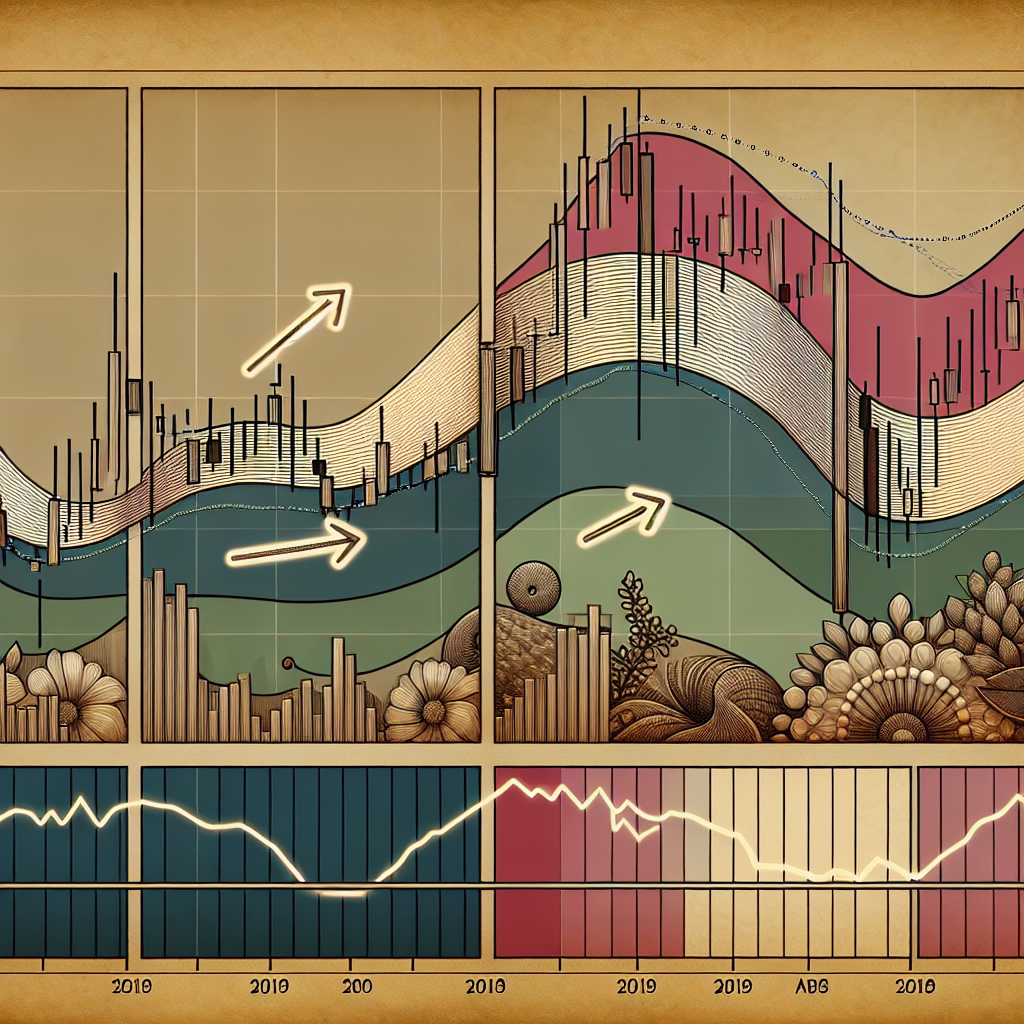
Moving averages are commonly used in trend analysis because they smooth out price data, creating a line that can help traders identify trends. Here’s how to use moving averages for trend analysis:
Identify the Trend Direction
Moving averages can help identify the direction of a trend. If the moving average line is rising, the trend is upward. Conversely, if the line is falling, the trend is downward. If the line is flat, the market is likely moving sideways and doesn’t have a clear trend.
Determine the Trend Strength
Moving averages can also help determine the strength of a trend. This can be done by looking at the angle of the moving average line. A steep angle indicates a strong trend, while a shallow angle indicates a weak trend. If the line is flat, the trend is likely non-existent.
Identify Trend Reversals
Another use of moving averages in trend analysis is to identify potential trend reversals. When the price crosses the moving average line, it could signal a potential trend reversal. However, this signal should be used in conjunction with other technical analysis tools to confirm the reversal.
Conclusion
In conclusion, moving averages are a powerful tool for trend analysis. They can help traders identify the direction, strength, and potential reversals of a trend. However, like all technical analysis tools, they should be used in conjunction with other indicators and methods to increase the chances of successful trading.