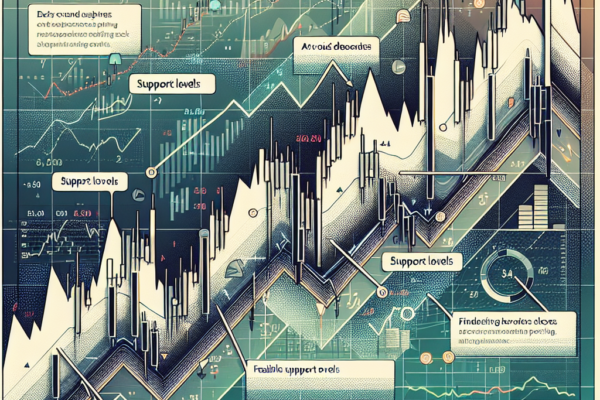
Guide to Identifying Reliable Support Levels in Trading
Finding Reliable Support Levels In the world of trading and investing, understanding support and resistance levels is crucial. These levels help traders make informed decisions about when to buy, sell, or hold a particular asset. This article will focus on finding reliable support levels, which are essentially the price levels at which demand is strong…


