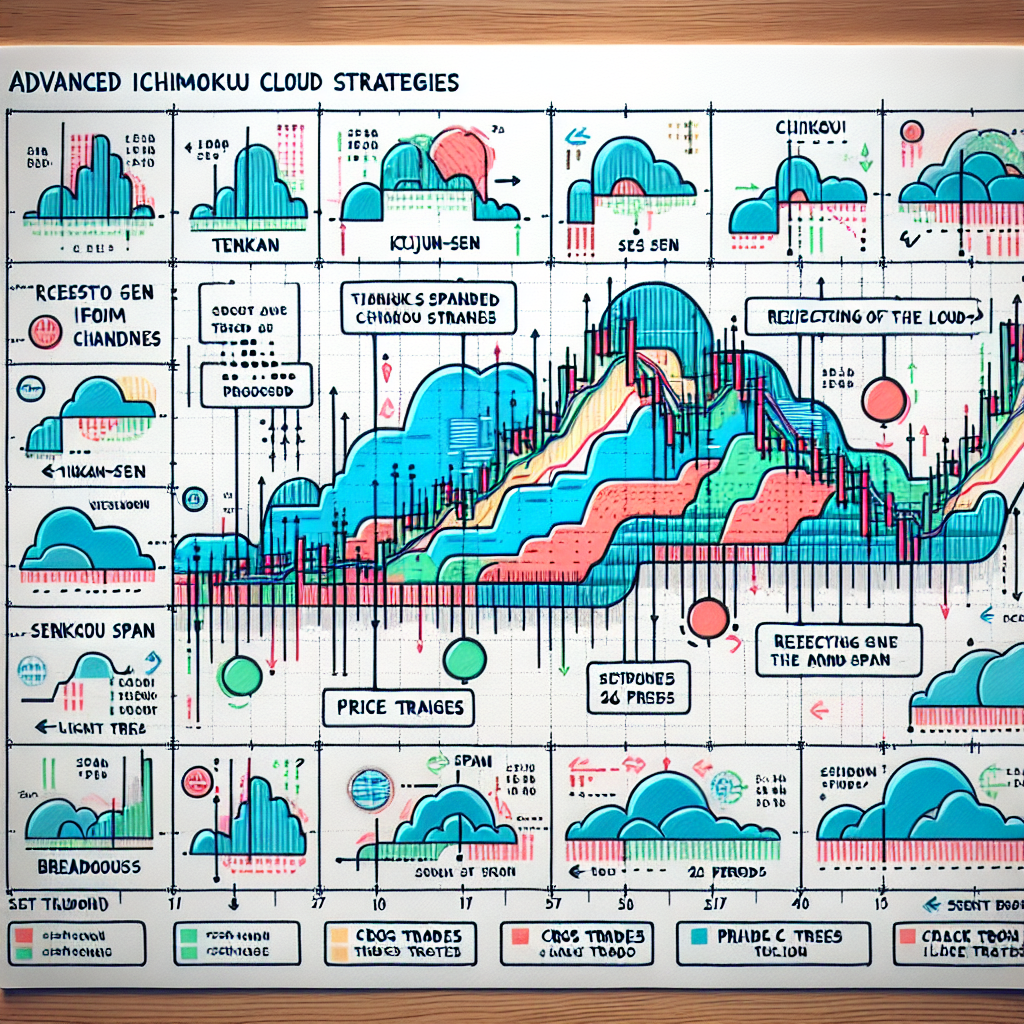
Introduction to Advanced Ichimoku Cloud Strategies
Ichimoku Kinko Hyo, commonly referred to as the Ichimoku Cloud, is a versatile technical analysis tool that offers a comprehensive overview of price action. It was developed by Goichi Hosoda, a Japanese journalist, in the late 1930s. The Ichimoku Cloud is a unique indicator that provides information about support and resistance levels, trend direction, momentum, and trade signals all at once. However, to maximize its potential, traders need to understand its advanced strategies.
Understanding the Ichimoku Cloud Components
Before diving into the advanced strategies, it’s crucial to understand the five primary components of the Ichimoku Cloud:
1. Tenkan-Sen (Conversion Line)
This is calculated by taking the average of the highest high and the lowest low over the last nine periods. It represents a short-term trader’s equilibrium and provides a minor support/resistance level.
2. Kijun-Sen (Base Line)
This line is the average of the highest high and the lowest low over the past 26 periods. It represents a longer-term trader’s equilibrium and provides a major support/resistance level.
3. Senkou Span A (Leading Span A)
This is the average of the Tenkan-Sen and the Kijun-Sen, plotted 26 periods ahead. It forms one edge of the Ichimoku Cloud.
4. Senkou Span B (Leading Span B)
This line is the average of the highest high and the lowest low over the past 52 periods, plotted 26 periods ahead. It forms the other edge of the Ichimoku Cloud.
5. Chikou Span (Lagging Span)
This line is the current closing price, plotted 26 periods behind. It is used to confirm other signals.
Advanced Ichimoku Cloud Strategies
1. The Cross Over Strategy
One of the most popular advanced Ichimoku strategies is the cross over strategy. This involves observing the Tenkan-Sen (Conversion Line) and the Kijun-Sen (Base Line). When the Tenkan-Sen crosses above the Kijun-Sen, it’s a bullish signal, and when it crosses below, it’s a bearish signal. However, the strength of the signal is determined by the location of the cross in relation to the Ichimoku Cloud.
2. The Kumo Twist Strategy
The Kumo (Cloud) twist strategy involves observing a change in the cloud’s color. This occurs when the Senkou Span A crosses the Senkou Span B. A twist from red to green indicates a bullish signal, whereas a twist from green to red indicates a bearish signal.
3. The Price Cross Strategy
This strategy involves observing when the price crosses the Kijun-Sen (Base Line). A cross above the Base Line is considered a bullish signal, while a cross below it is a bearish signal.
4. The Chikou Span Confirmation Strategy
The Chikou Span (Lagging Span) is used to confirm other signals. If the Chikou Span is above the price from 26 periods ago, it’s a bullish signal. If it’s below the price from 26 periods ago, it’s a bearish signal.
Conclusion
The Ichimoku Cloud is a highly versatile and effective trading tool that can provide a wealth of information at a glance. However, like any technical analysis tool, it’s not infallible and should be used in conjunction with other indicators and strategies. By understanding and applying these advanced Ichimoku Cloud strategies, traders can make more informed decisions and potentially increase their profitability.


