Understanding Support and Resistance Levels
In the world of technical analysis in trading, support and resistance levels are a fundamental concept that every trader should understand. These levels are key to making informed decisions about when to enter and exit trades, and can help traders predict how prices will move in the future.
What are Support and Resistance Levels?
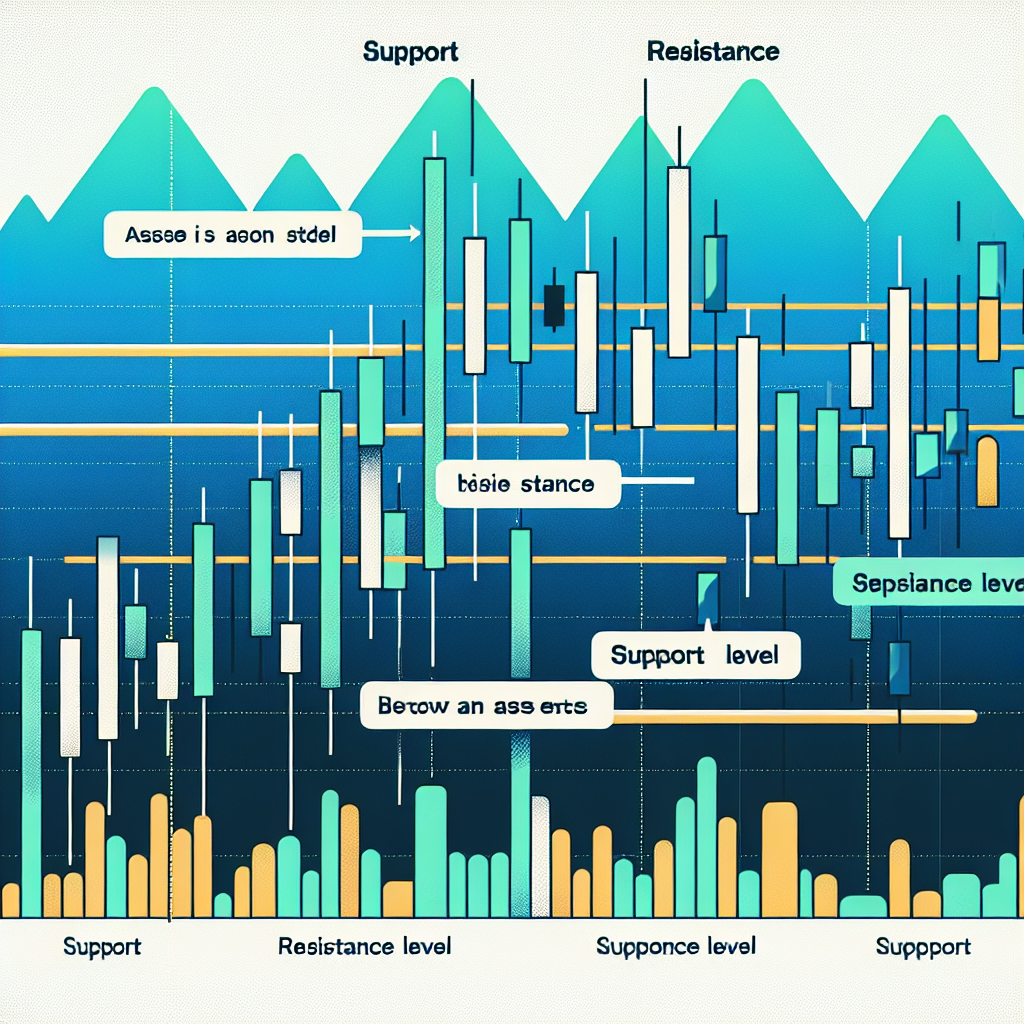
Support and resistance levels are horizontal lines that represent the levels at which a stock price has historically had a hard time moving beyond. They act as psychological barriers that the market participants have perceived as a good price to buy or sell the asset.
Support Levels
A support level is the price level at which a stock or market can trade down to but not go through, due to more buyers being interested in buying it at that price than sellers are in selling it. It’s essentially the level at which demand is strong enough to prevent the price from falling further.
Resistance Levels
A resistance level, on the other hand, is the price level at which a stock or market can trade up to but not go through, due to more sellers being interested in selling it at that price than buyers are in buying it. It’s the level at which supply is strong enough to prevent the price from rising further.
Why are Support and Resistance Levels Important?
Support and resistance levels are crucial in technical analysis because they give traders a clear picture of supply and demand. When these levels are broken, they signal a change in the balance of supply and demand, which can lead to significant price movements.
Identifying Market Trends
Support and resistance levels help traders identify market trends. If a price breaks through a resistance level and keeps rising, the market is in an uptrend. Conversely, if a price breaks through a support level and keeps falling, the market is in a downtrend.
Planning Trade Entries and Exits
These levels also help traders plan their trade entries and exits. Traders often look to buy when the price bounces off a support level and sell when it bounces off a resistance level. If a price breaks through a support or resistance level, traders might look to enter a trade in the direction of the break and exit when the price reaches the next support or resistance level.
How to Identify Support and Resistance Levels
Identifying support and resistance levels involves looking at a stock or market’s price history. Traders typically use charts to do this, looking for price levels at which the stock has repeatedly bounced back after falling (support) or pulled back after rising (resistance).
Using Technical Indicators
There are also technical indicators that can help traders identify these levels, such as pivot points, Fibonacci retracements, and moving averages. These tools can provide a more objective way to identify support and resistance levels, particularly for traders who are new to technical analysis.
Conclusion
Understanding support and resistance levels is an essential part of technical analysis and trading. By identifying these levels, traders can make more informed decisions about when to enter and exit trades, anticipate potential price movements, and gain a deeper understanding of market trends. Whether you’re a novice trader or an experienced professional, mastering this concept can significantly enhance your trading strategy.


