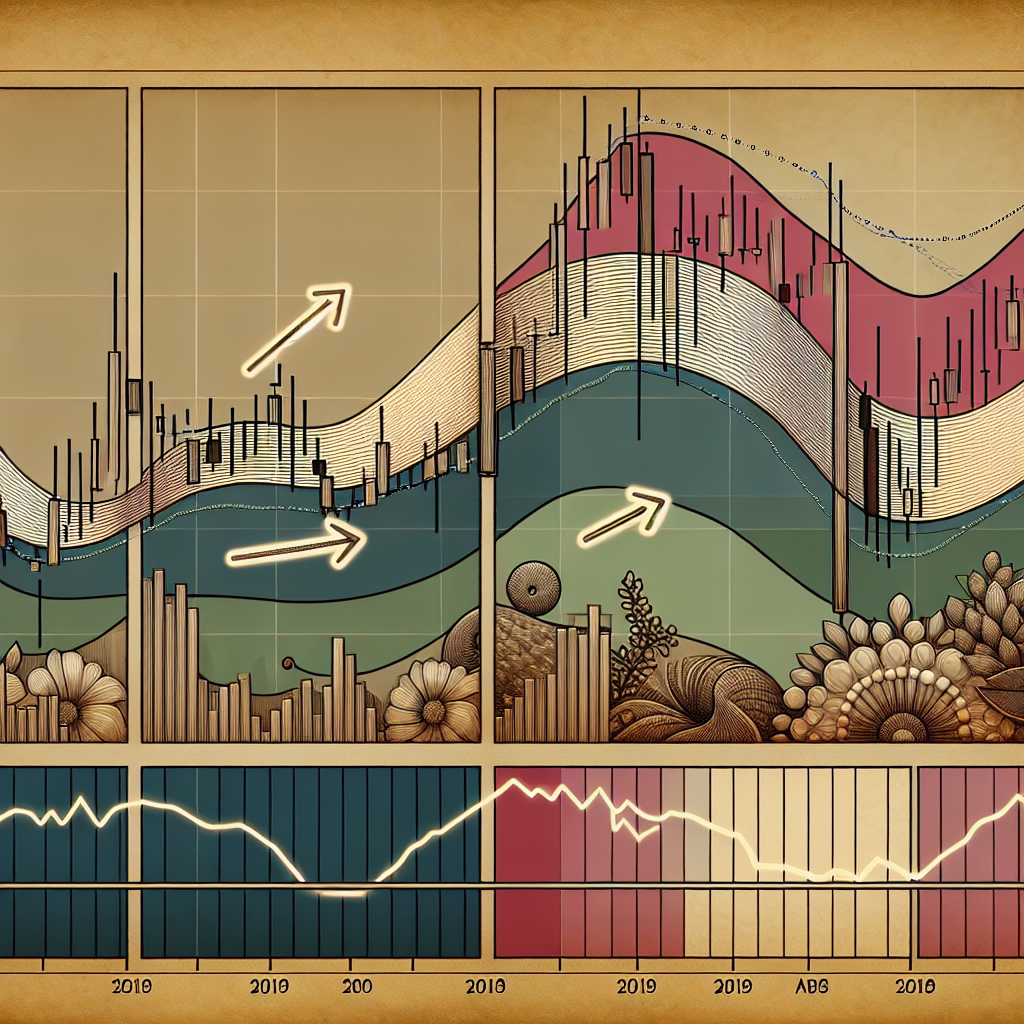
Introduction to Trading with MACD Crossovers
The Moving Average Convergence Divergence (MACD) is a popular momentum oscillator used in technical analysis. It is used to identify potential buy and sell signals and to gauge the strength of a trend. One of the key aspects of MACD is the concept of “crossovers.” In this article, we will delve into the intricacies of trading with MACD crossovers.
Understanding MACD
Before we talk about crossovers, it’s important to understand the basics of MACD. It consists of two lines – the MACD line and the signal line – and a histogram. The MACD line is the difference between the 12-day and 26-day exponential moving averages (EMAs), while the signal line is the 9-day EMA of the MACD line. The histogram represents the difference between the MACD line and the signal line.
MACD Line
The MACD line is calculated by subtracting the 26-day EMA from the 12-day EMA. This line is used to identify potential buy and sell signals.
Signal Line
The signal line is the 9-day EMA of the MACD line. It acts as a trigger for buy and sell signals.
Histogram
The histogram is the visual representation of the difference between the MACD line and the signal line. It helps traders visualize the degree of divergence or convergence between these two lines.
Trading with MACD Crossovers
MACD crossovers are a critical part of MACD trading strategies. There are two types of crossovers: bullish and bearish.
Bullish Crossover
A bullish crossover occurs when the MACD line crosses above the signal line. This is considered a bullish (buy) signal as it indicates that the short-term momentum is rising faster than the long-term momentum.
Bearish Crossover
A bearish crossover happens when the MACD line crosses below the signal line. This is considered a bearish (sell) signal as it shows that the short-term momentum is falling faster than the long-term momentum.
Effective Use of MACD Crossovers
While MACD crossovers can be a powerful tool, they should not be used in isolation. Traders should always consider other technical indicators and market conditions to confirm the signals provided by MACD crossovers.
Confirm with Other Indicators
MACD crossovers can produce false signals, especially in volatile markets. To increase the accuracy of your trading decisions, consider using other indicators like the Relative Strength Index (RSI) or Bollinger Bands.
Consider Market Conditions
Market conditions can greatly affect the effectiveness of MACD crossovers. For instance, in a trending market, MACD crossovers can be very effective. However, in a ranging market, they may produce many false signals.
Conclusion
Trading with MACD crossovers can be a robust strategy when used correctly. It’s crucial to understand how the MACD works, and the significance of its components. Remember, while MACD crossovers can provide valuable buy and sell signals, they should be used in conjunction with other technical analysis tools and market information to increase the chances of successful trades.


