Understanding RSI Divergence
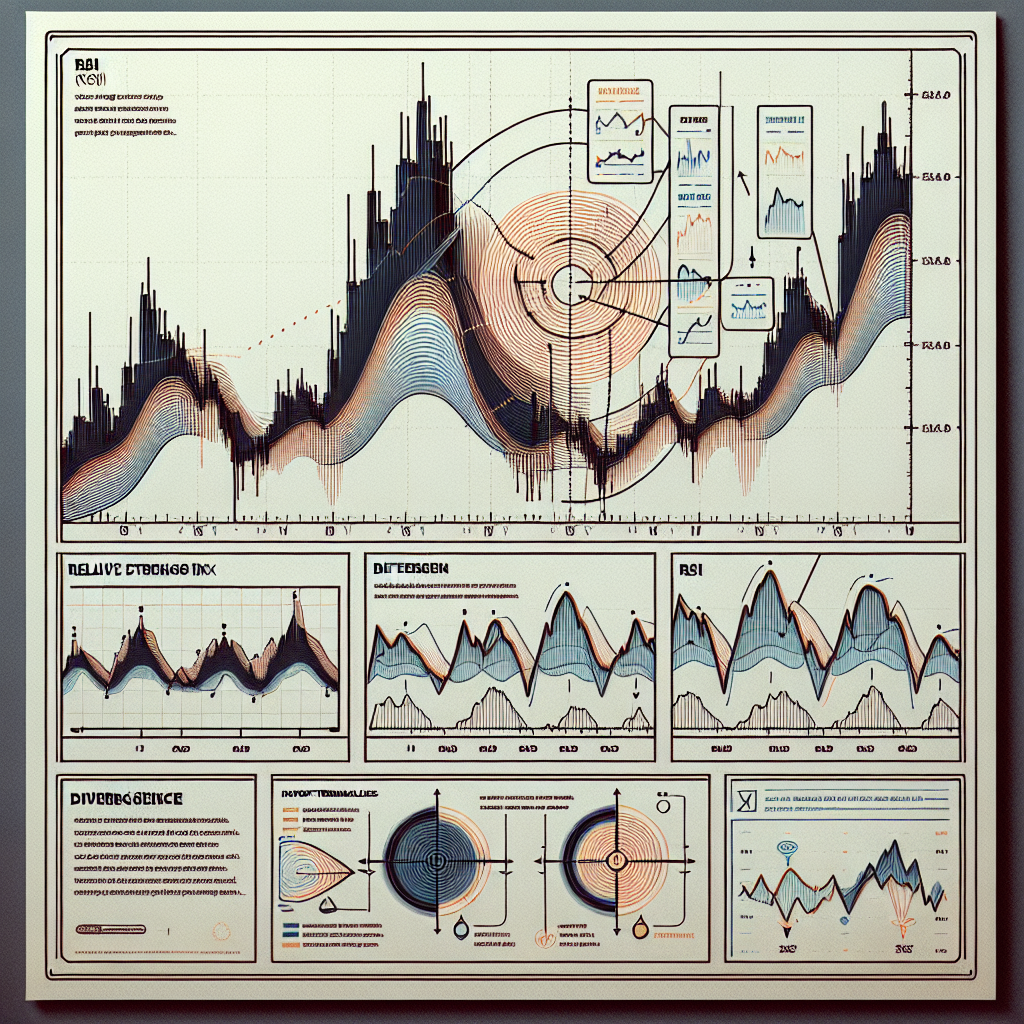
RSI, or Relative Strength Index, is a momentum oscillator that measures the speed and change of price movements. It operates on a scale from 0 to 100, aiming to indicate overbought or oversold conditions. However, one of its most significant aspects for traders is its ability to highlight divergence. RSI divergence can be a powerful tool in predicting potential market reversals. Identifying RSI divergence involves comparing the direction of the RSI line with the direction of price action, revealing discrepancies that could signal an upcoming shift in trend.
Types of RSI Divergence
RSI divergence can be categorized into two main types: bullish and bearish. Understanding these will enable traders to better anticipate and react to potential market movements.
Bullish RSI Divergence
Bullish divergence occurs when the price of an asset makes a new low while the RSI makes a higher low. This indicates weakening downward momentum and potentially signals a bullish reversal. In practical terms, it suggests that despite the price dropping, the rate at which selling pressure is decreasing suggests a weakening bearish trend.
Bearish RSI Divergence
Conversely, bearish divergence happens when the price reaches a new high while the RSI forms a lower high. This scenario points to diminishing upward momentum, possibly heralding a bearish reversal. Here, the implication is that even though prices are climbing, the slowing pace of buying indicates the bullish trend is running out of steam.
Steps to Identify RSI Divergence
Identifying RSI divergence involves several key steps, each of which helps traders confirm the divergence and the potential for a shift in market direction.
Step 1: Choose the Right Settings for RSI
Begin by selecting an appropriate period settings for the RSI. The standard setting is 14 periods, which works well for identifying divergence. This setting can be adjusted based on the trading strategy and the timeframe being analyzed.
Step 2: Observe the Price Action
Examine the price chart carefully, looking for new highs or lows in price movements. These are critical points to watch for potential divergence signals.
Step 3: Compare Price Action to RSI
With key price points in mind, compare these movements to the RSI line. Look for contradictions between price action and the RSI trend. For example, if the price makes a new low, but the RSI does not, divergence may be present.
Step 4: Confirm Divergence
Once a potential divergence is spotted, double-check to confirm. This includes ensuring the divergence is significant and not just a minor discrepancy. It’s also advisable to look for confirmation signals, such as a trendline break on the price chart or a reversal pattern.
Trading Based on RSI Divergence
While RSI divergence can be a strong signal for potential trend reversals, traders should practice caution. It’s essential to use divergence signals in conjunction with other indicators and analysis methods to confirm potential trades. Additionally, setting appropriate stop-loss orders and risk management strategies is crucial to protect against false signals or unexpected market moves.
Conclusion
RSI divergence is a valuable tool in a trader’s arsenal, offering insights into potential reversals before they become apparent through price action alone. By diligently following the steps to identify both bullish and bearish divergences and combining this analysis with other technical indicators, traders can make more informed decisions, manage risk effectively, and capitalize on reversal opportunities in the market.