Recognizing Double Tops and Bottoms in Trading
Trading in the financial market involves a lot of analysis and understanding of various patterns and trends. Among these patterns, the double tops and bottoms are common and often signal a potential trend reversal. Recognizing these patterns can provide traders with a significant advantage in predicting price movements.
Understanding Double Tops
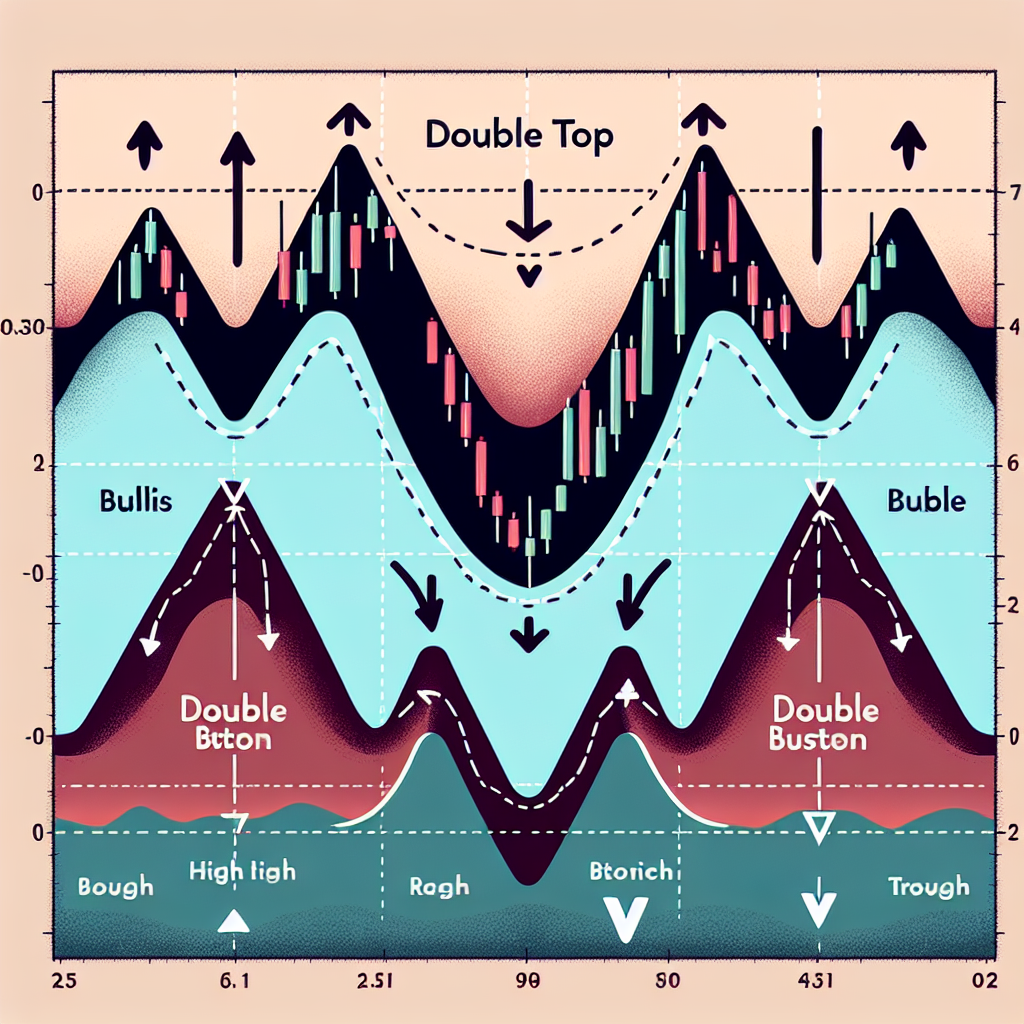
A double top pattern is a classic chart pattern used in technical analysis. It is characterized by a price rise to a new high followed by a moderate pullback and a subsequent rise to the same level as the first peak, forming what looks like an ‘M’ shape on the chart.
Identifying a Double Top
The first step to identifying a double top is to look for a significant upward trend. Following this rise, the price will reach a peak and then decrease, forming the first ‘top’. After this decline, the price will then rise again, reaching a similar peak as the first one. If the price falls again after this second peak, you have identified a double top pattern.
Trading a Double Top
A double top pattern is a bearish reversal signal. When you identify this pattern, it suggests that the price may soon fall. As such, traders often use this as a signal to sell or to open a short position. The confirmation of this pattern comes when the price breaks below the ‘neckline’ – the support level connecting the two tops.
Understanding Double Bottoms
The double bottom pattern is the opposite of the double top pattern. It is a bullish reversal pattern that looks like a ‘W’ on the chart. It often forms after a prolonged downtrend and signals a potential upward price movement.
Identifying a Double Bottom
To identify a double bottom, you need to look for a significant downward trend. Following this decline, the price will reach a low point and then rise, forming the first ‘bottom’. After this rise, the price will then fall again, reaching a similar low point as the first one. If the price rises after this second bottom, you have identified a double bottom pattern.
Trading a Double Bottom
A double bottom pattern is a bullish reversal signal. When you identify this pattern, it suggests that the price may soon rise. Traders often use this as a signal to buy or to open a long position. The confirmation of this pattern comes when the price breaks above the ‘neckline’ – the resistance level connecting the two bottoms.
Conclusion
Recognizing double tops and bottoms can be a powerful tool for traders. These patterns can provide early signals of potential trend reversals, enabling traders to make strategic decisions. However, it’s important to remember that no pattern is 100% reliable, and these signals should be used in conjunction with other technical analysis tools and indicators to confirm potential trading opportunities.


