Drawing Accurate Trend Lines
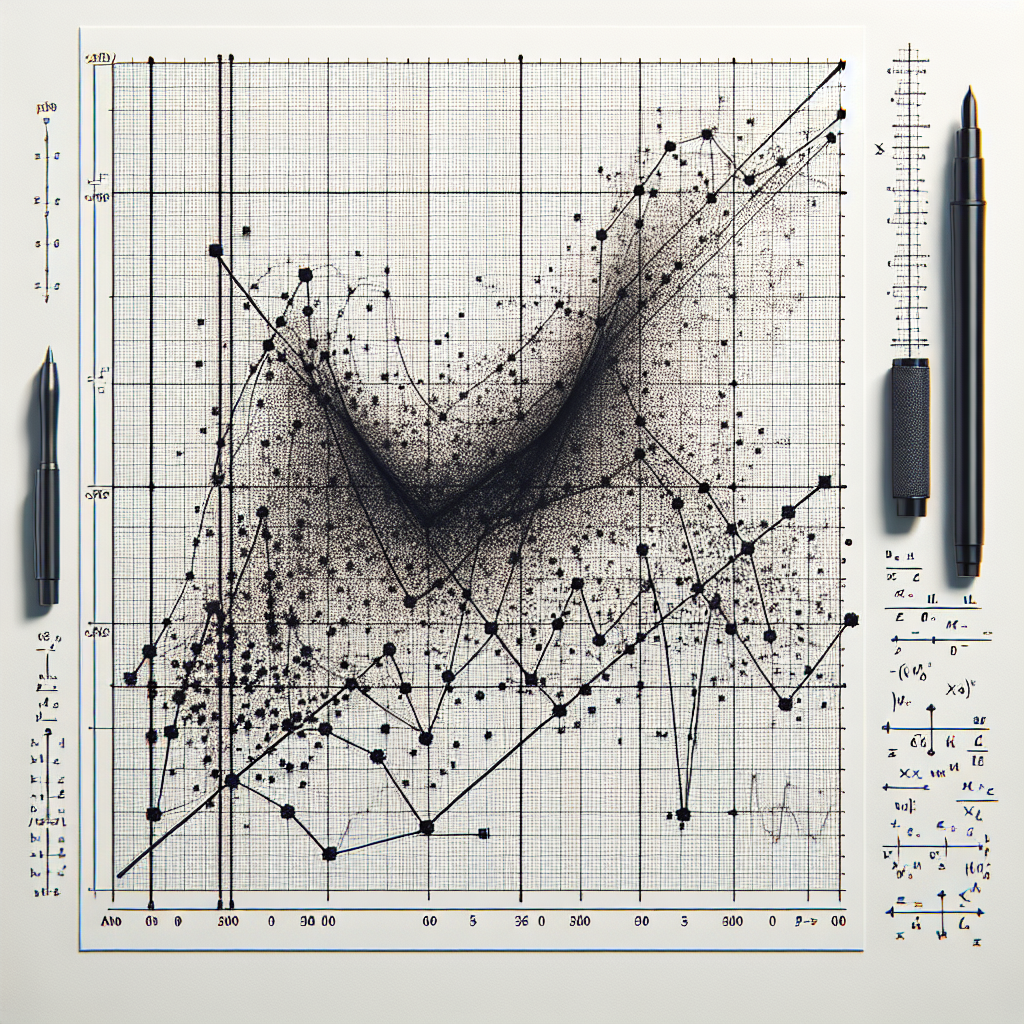
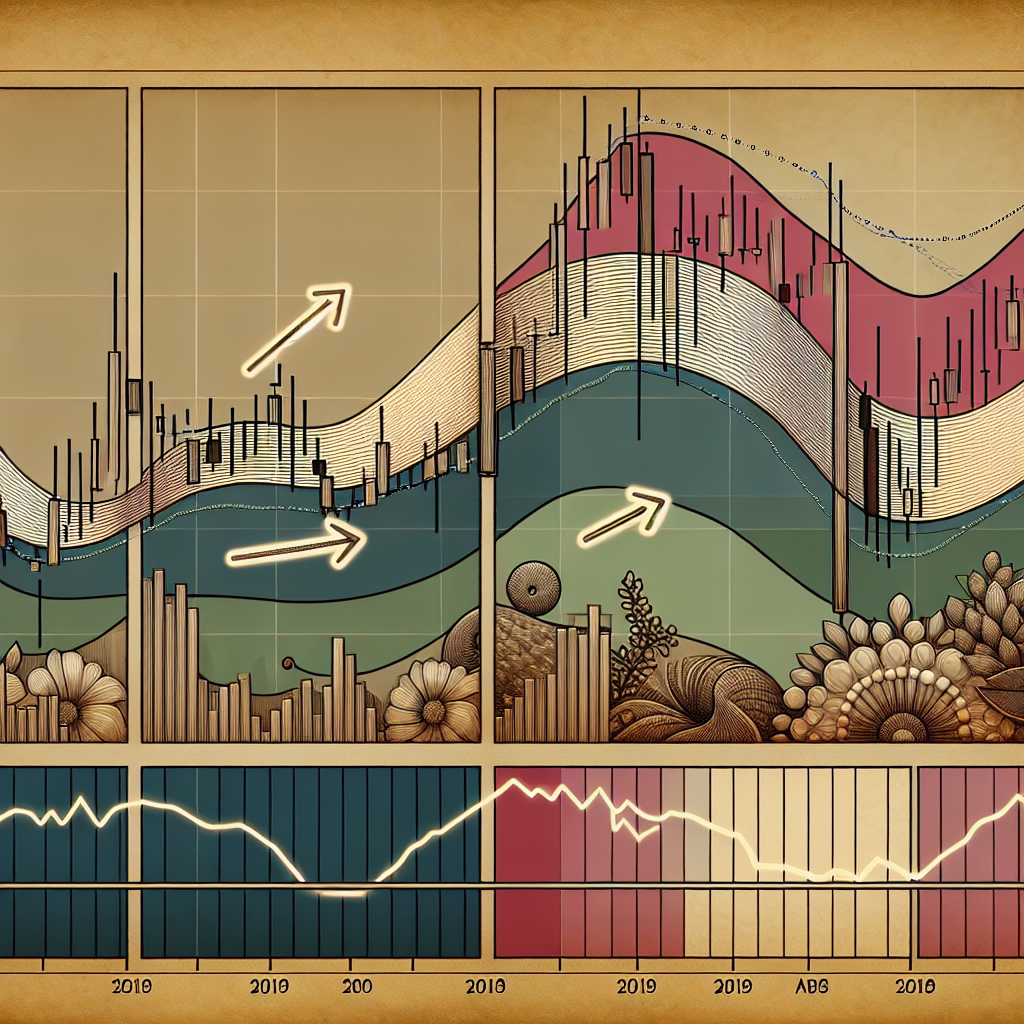
Trend lines are an essential tool in technical analysis for both trend identification and confirmation. A trend line is a straight line that connects two or more price points and then extends into the future to act as a line of support or resistance. Many of the principles applicable to support and resistance levels can be applied to trend lines as well.
Understanding Trend Lines
Before delving into the steps of drawing accurate trend lines, it’s important to understand what they are and why they are important. Trend lines are graphical representations of price trends in markets. They can indicate the direction of the trend, its strength, and the potential for reversals.
Why are Trend Lines Important?
Trend lines are used by traders and investors to identify and confirm trends and to identify potential reversal points in the market. They provide visual representations of supply and demand and can be used to identify buying and selling opportunities.
Steps to Drawing Accurate Trend Lines
Drawing accurate trend lines is a skill that can be developed over time. Here are the steps to follow:
Step 1: Identify Highs and Lows
The first step in drawing a trend line is identifying the highs and lows on the price chart. For an uptrend, you will connect the higher lows, and for a downtrend, you will connect the lower highs.
Step 2: Connect the Dots
Once you’ve identified the highs and lows, the next step is to connect these points using a straight line. The line should touch at least two points, but three or more is ideal for a more accurate trend line.
Step 3: Extend the Line
After connecting the highs or lows, extend the line out to the right to see where the price could potentially go in the future. This extended line will act as a line of support in an uptrend and a line of resistance in a downtrend.
Common Mistakes When Drawing Trend Lines
While trend lines can be a useful tool, there are common mistakes that traders often make when drawing them.
Mistake 1: Drawing Too Many Lines
One common mistake is drawing too many lines. This can lead to confusion and may cause you to miss the overall trend.
Mistake 2: Ignoring Volume
Another common mistake is ignoring volume. Volume can confirm the strength of a trend and should be considered when drawing trend lines.
Mistake 3: Not Adjusting Lines
Trend lines should be adjusted as new data becomes available. Not adjusting your lines can result in inaccurate trend lines.
Conclusion
Trend lines can be a valuable tool in technical analysis. By understanding how to draw them accurately, you can identify trends, spot potential reversals, and make more informed trading decisions. Remember, practice makes perfect in mastering this skill.


