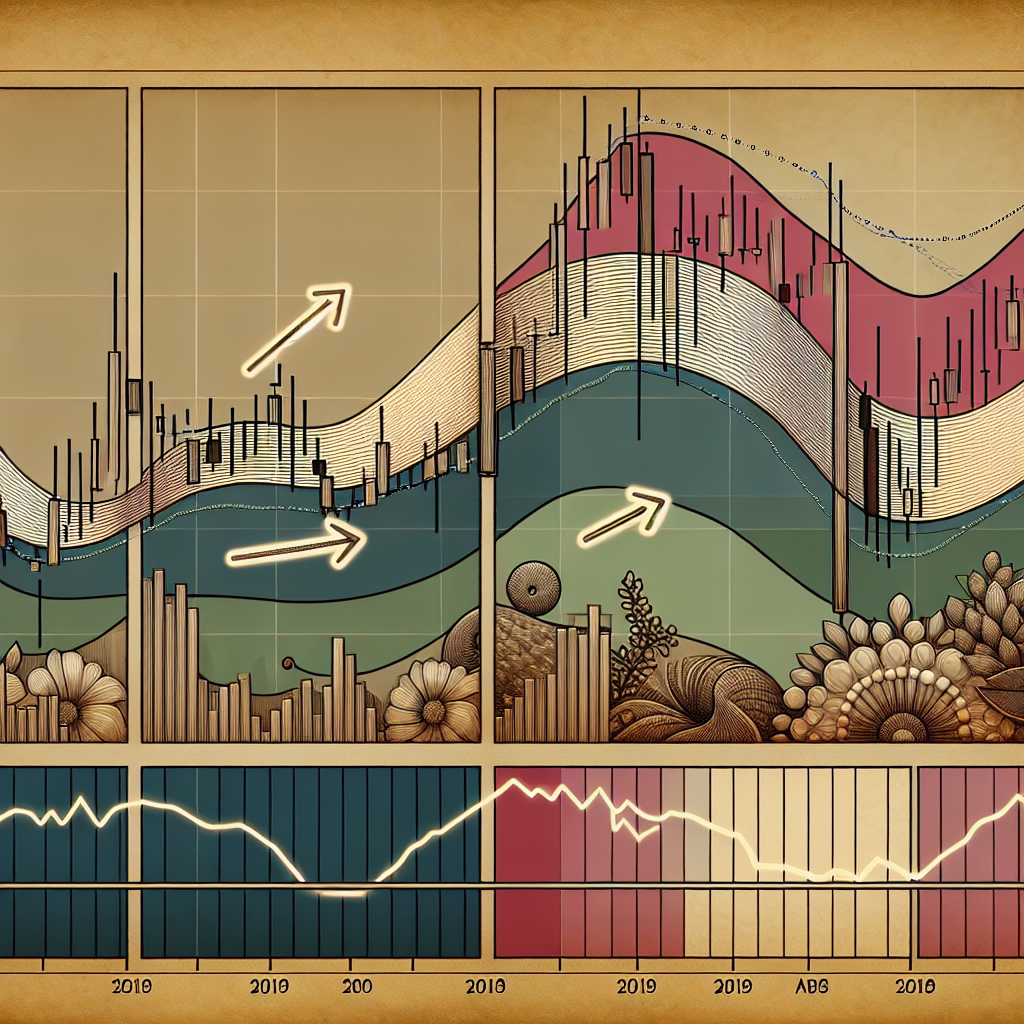
Introduction to RSI Divergence for Trade Entry
In the world of trading, there are numerous strategies and indicators that traders use to make informed decisions. One such strategy is the use of RSI divergence for trade entry. RSI, or Relative Strength Index, is a momentum oscillator that measures the speed and change of price movements. When used correctly, RSI divergence can be a powerful tool for determining the best time to enter a trade.
Understanding RSI Divergence
What is RSI Divergence?
RSI divergence occurs when the price of a security moves in the opposite direction of the RSI indicator. This divergence can be a bullish or bearish signal, depending on the direction of the price movement. A bullish divergence occurs when the price of a security is making new lows while the RSI is failing to make new lows. On the other hand, a bearish divergence occurs when the price is making new highs while the RSI is failing to make new highs.
How to Identify RSI Divergence
Identifying RSI divergence involves examining the price chart and the RSI indicator chart. The first step is to identify the peaks and troughs on both charts. If the price is making higher highs and the RSI is making lower highs, this is a bearish divergence. If the price is making lower lows and the RSI is making higher lows, this is a bullish divergence.
Using RSI Divergence for Trade Entry
When to Enter a Trade
The RSI divergence can be a powerful signal for trade entry. When you spot a bullish divergence, this could be a good time to enter a long trade or buy. Conversely, when you spot a bearish divergence, this could be a good time to enter a short trade or sell. However, it’s important to keep in mind that RSI divergence is not a standalone indicator. It should be used in conjunction with other technical analysis tools and indicators to confirm the signal.
Setting Stop Loss and Take Profit Levels
When using RSI divergence for trade entry, it’s crucial to also set stop loss and take profit levels. A stop loss level is the price at which you will exit the trade if it goes against you, limiting your losses. A take profit level is the price at which you will exit the trade if it goes in your favor, securing your profits.
The stop loss level can be set just below the most recent low in case of a bullish divergence and just above the most recent high in case of a bearish divergence. The take profit level can be set at a previous resistance level for a bullish divergence and at a previous support level for a bearish divergence.
Conclusion
RSI divergence can be a valuable tool in a trader’s arsenal, providing potential signals for trade entry. However, like any trading strategy, it’s not foolproof and should be used in conjunction with other technical analysis tools and indicators. By understanding how to identify and use RSI divergence, traders can make more informed decisions and potentially increase their chances of successful trades.


