Introduction to Risk Management and Technical Analysis
Risk management is a critical aspect of investing and trading in financial markets. It involves identifying, analyzing, and accepting or mitigating the uncertainties in investment decisions. Technical analysis, on the other hand, is a trading discipline employed to evaluate investments and identify trading opportunities by analyzing statistical trends gathered from trading activity, such as price movement and volume.
When used together, risk management and technical analysis can provide a robust framework for making informed trading decisions. They can help traders minimize potential losses and maximize returns.
Understanding Risk Management
Risk management in trading refers to the identification and management of potential losses in an investment strategy. It involves setting up measures to reduce the adverse effects of unpredictable market movements. The primary goal of risk management is to ensure that the amount a trader is willing to lose on a trade does not affect their long-term trading capital.
Key Components of Risk Management
Risk management involves several key components, including:
1. Risk Identification: This involves identifying the potential risks that could negatively impact an investment.
2. Risk Analysis: This involves evaluating the potential impact and likelihood of identified risks.
3. Risk Evaluation: This involves comparing the analyzed risks with criteria set up by the trader.
4. Risk Treatment: This involves deciding on the best method to handle each risk.
Understanding Technical Analysis
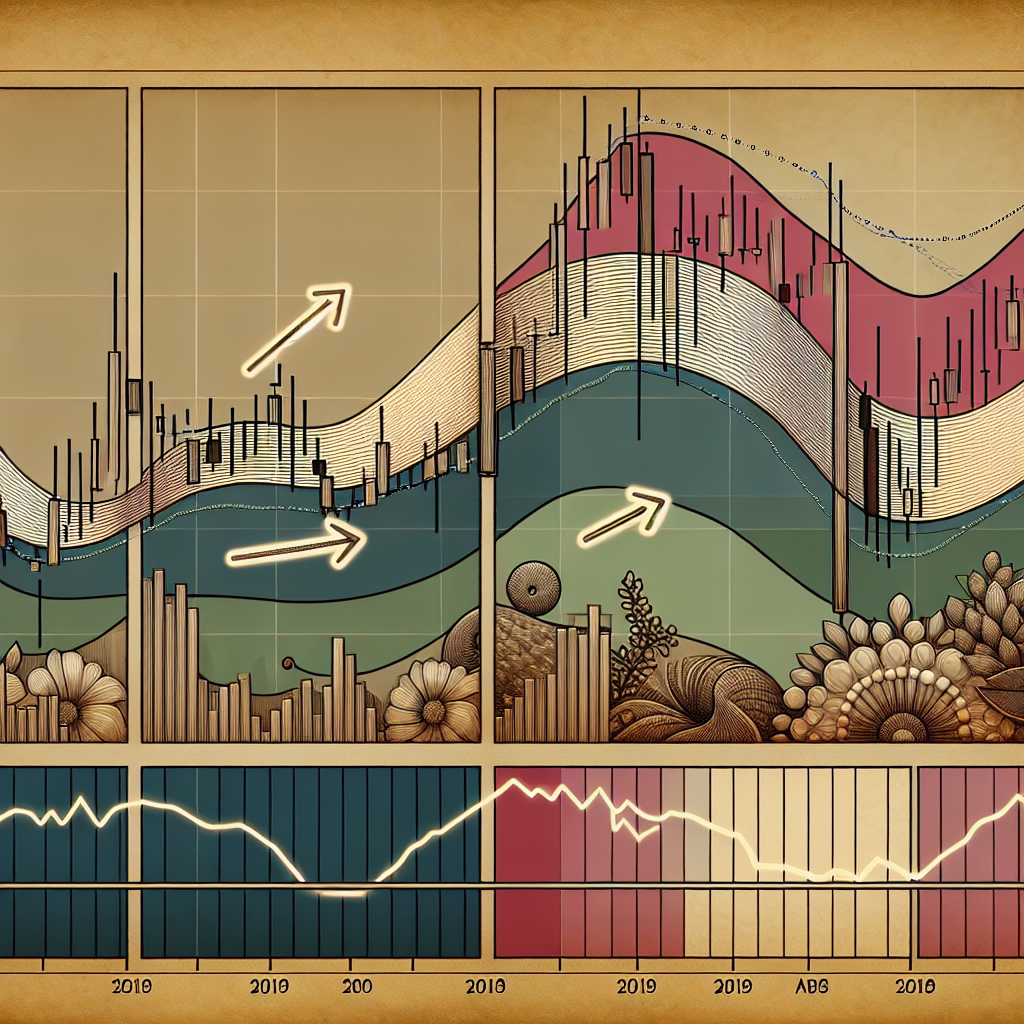
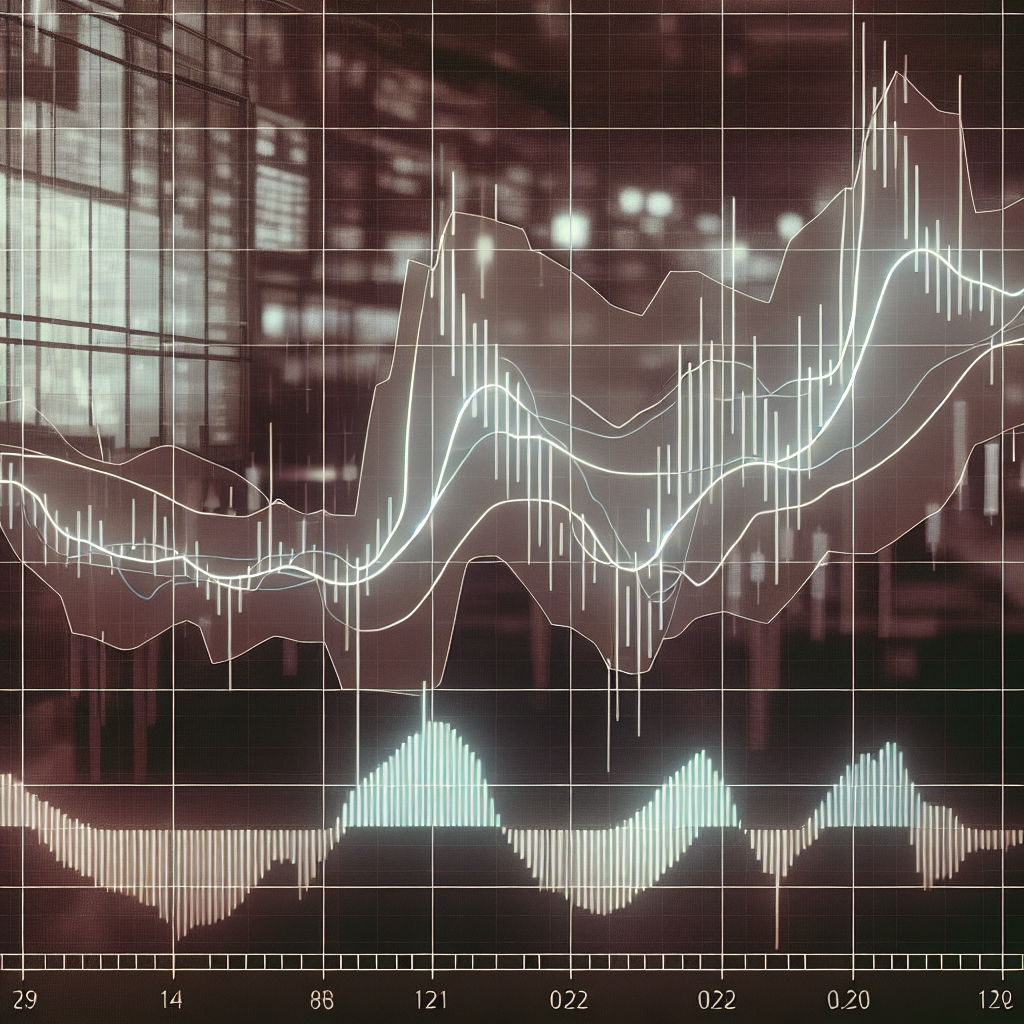
Technical analysis is a method of predicting the future direction of a market’s price by studying past market data, primarily price and volume. It involves the use of various tools and techniques, including chart patterns, technical indicators, and statistical analysis.
Key Components of Technical Analysis
Technical analysis involves several key components, including:
1. Price Charts: These are graphical representations of price movements over a specific period.
2. Technical Indicators: These are mathematical calculations based on a security’s price and volume.
3. Chart Patterns: These are distinct formations created by price movements that are identified using line graphs, bar graphs, or candlestick charts.
Combining Risk Management and Technical Analysis
When used together, risk management and technical analysis can be a powerful tool for traders. Here’s how they can work together:
Identifying Trading Opportunities
Technical analysis can help traders identify potential trading opportunities. For example, a trader might use technical indicators to identify a potential bullish trend. Once a potential opportunity has been identified, the trader can then use risk management principles to determine the amount of capital to risk on the trade.
Setting Stop Loss and Take Profit Levels
Technical analysis can also help traders set stop-loss and take-profit levels. A stop-loss order is a defensive mechanism that can protect a trader from a significant loss. On the other hand, a take-profit order allows a trader to lock in a profit when a certain price level is reached.
Managing Risk-Reward Ratio
Risk management involves determining the potential risk and reward of a trade, often referred to as the risk-reward ratio. Technical analysis can help traders identify potential reward targets, while risk management principles can help determine the appropriate amount to risk.
Conclusion
Risk management using technical analysis is an essential aspect of successful trading. It allows traders to make informed decisions, manage their risks effectively, and maximize their potential returns. While technical analysis helps in identifying potential trading opportunities, risk management ensures that these opportunities are seized with a balanced approach to risk and reward.


