Introduction to Ichimoku Cloud Trading Signals
Ichimoku Cloud, also known as Ichimoku Kinko Hyo, is a versatile technical analysis tool that provides traders with a comprehensive overview of the market. The tool was developed by a Japanese journalist, Goichi Hosoda, in the late 1930s, and it’s designed to provide traders with a complete picture of the market at a glance, including trend direction, momentum, and support and resistance levels.
Understanding the Ichimoku Cloud
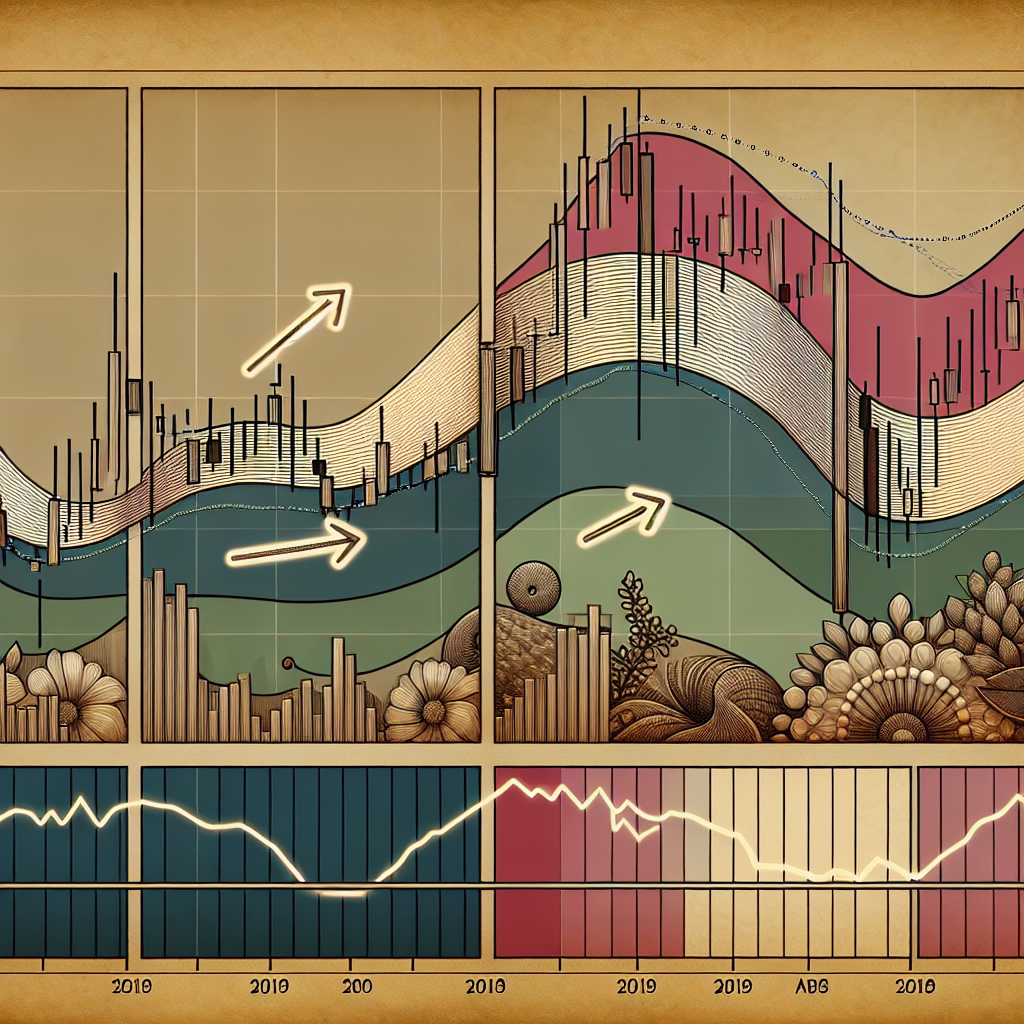
Before delving into the various trading signals generated by the Ichimoku Cloud, it’s important to understand its components. The Ichimoku Cloud consists of five lines:
1. Tenkan-Sen (Conversion Line)
This line is calculated by averaging the highest high and the lowest low for the past nine periods. It represents short-term price momentum.
2. Kijun-Sen (Base Line)
This line is calculated by averaging the highest high and the lowest low for the past 26 periods. It represents medium-term price momentum.
3. Senkou Span A (Leading Span A)
This line is calculated by averaging the Tenkan-Sen and the Kijun-Sen, and it’s plotted 26 periods ahead. It forms one of the edges of the Ichimoku Cloud.
4. Senkou Span B (Leading Span B)
This line is calculated by averaging the highest high and the lowest low for the past 52 periods, and it’s plotted 26 periods ahead. It forms the other edge of the Ichimoku Cloud.
5. Chikou Span (Lagging Span)
This line is the current closing price plotted 26 periods behind.
Ichimoku Cloud Trading Signals
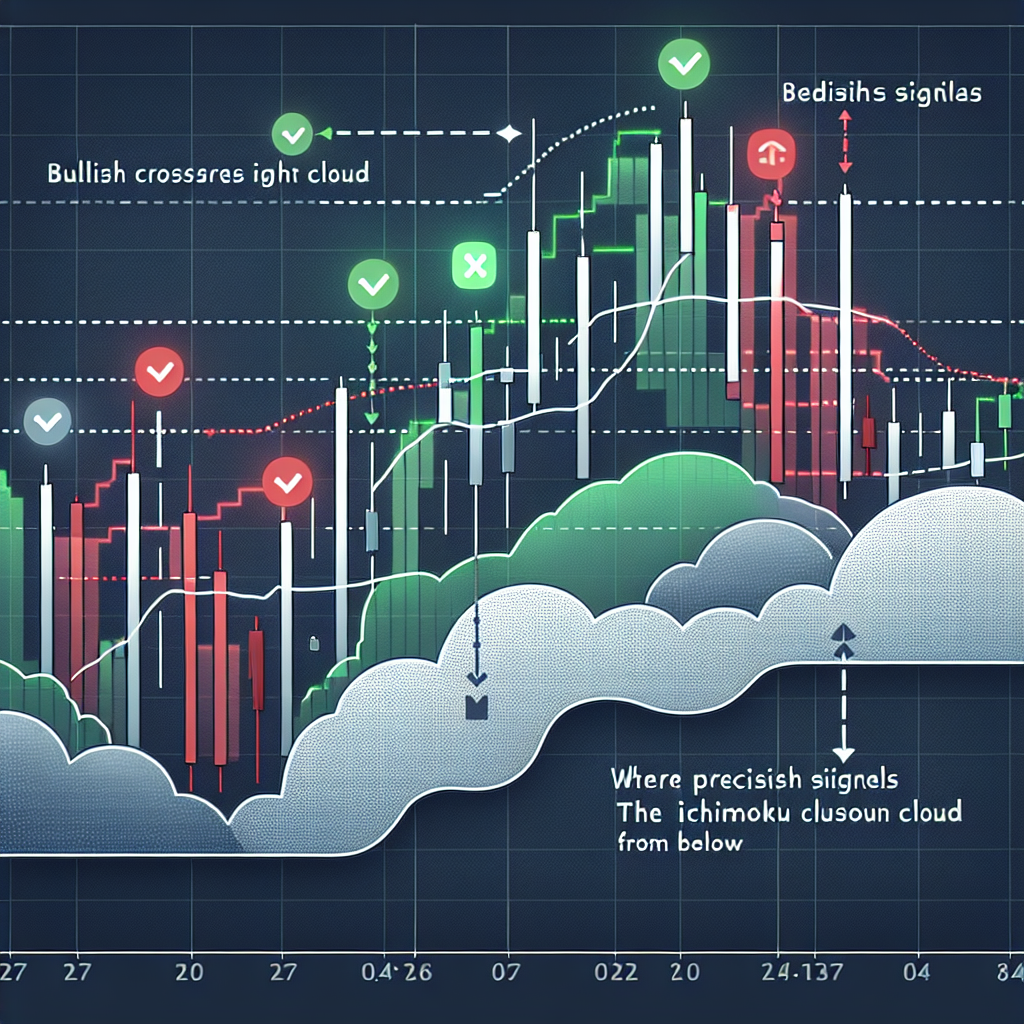
The Ichimoku Cloud generates various trading signals, which can be categorized into three main types: crossover signals, confirmation signals, and breakout signals.
1. Crossover Signals
These signals occur when the Tenkan-Sen crosses the Kijun-Sen. A bullish signal is generated when the Tenkan-Sen crosses above the Kijun-Sen, and a bearish signal is generated when the Tenkan-Sen crosses below the Kijun-Sen.
2. Confirmation Signals
These signals are used to confirm the trend direction indicated by the crossover signals. If the price is above the cloud, the trend is considered bullish, and if the price is below the cloud, the trend is considered bearish.
3. Breakout Signals
These signals occur when the price breaks out of the cloud. A bullish breakout signal is generated when the price breaks above the cloud, and a bearish breakout signal is generated when the price breaks below the cloud.
Conclusion
The Ichimoku Cloud is a powerful trading tool that can provide traders with a comprehensive overview of the market. By understanding the various trading signals generated by the Ichimoku Cloud, traders can make more informed trading decisions. However, like all trading tools, it’s important to use the Ichimoku Cloud in conjunction with other technical analysis tools and strategies to increase the chances of trading success.


