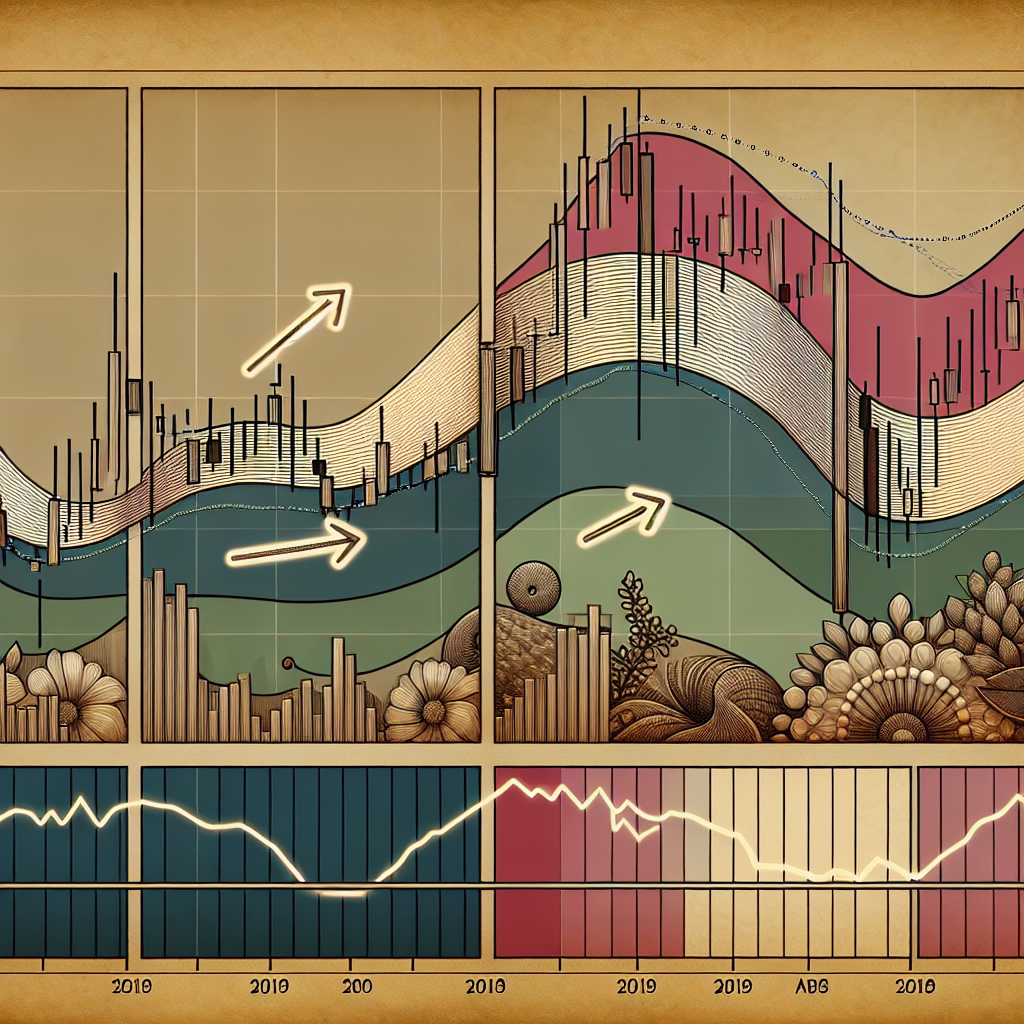
Using Bollinger Bands for Trading
Introduction to Bollinger Bands
Bollinger Bands are a technical analysis tool developed by John Bollinger in the 1980s. The bands are used to measure the highness or lowness of the price relative to previous trades. They consist of a middle band and two outer bands. The middle band is a simple moving average, while the outer bands are standard deviations away from the middle band. Bollinger Bands are a volatility indicator and commonly used in stock trading to identify overbought or oversold conditions.
Understanding Bollinger Bands
Bollinger Bands are based on a simple moving average (SMA) of a particular period, usually 20 days. The upper and lower bands are then calculated by adding and subtracting a set number of standard deviations, typically two, from the middle band. When the bands come close together, constricting the moving average, it is called a squeeze. A squeeze signals a period of low volatility and is considered by traders to be a potential sign of future increased volatility and possible trading opportunities. Conversely, the wider apart the bands move, the more likely the chance of a decrease in volatility and the greater the possibility of exiting a trade.
How to Use Bollinger Bands in Trading
Step 1: Identify the Trend
Before using Bollinger Bands, a trader should first identify the trend of the market. If the market is in an uptrend, the middle band will act as a support level. If the market is in a downtrend, the middle band will act as a resistance level.
Step 2: Watch for the Bollinger Band Squeeze
A Bollinger Band squeeze occurs when volatility falls to low levels and the Bollinger Bands narrow. Periods of low volatility are often followed by periods of high volatility. Therefore, a contraction of volatility or narrowing of the bands can foreshadow a significant advance or decline.
Step 3: Use Bollinger Bands with Other Indicators
While Bollinger Bands can help generate buy and sell signals, they are not designed to determine the future direction of a security. The bands were designed to augment other analysis techniques and indicators. By themselves, Bollinger Bands do not provide a comprehensive picture of a market’s movements.
Limitations of Using Bollinger Bands
While Bollinger Bands can be a useful tool for traders, they do have their limitations. They are not a standalone trading system and should be used in conjunction with other technical analysis tools to confirm signals. Additionally, during a period of increasing volatility, the bands widen, potentially leading to more false signals. Finally, Bollinger Bands do not provide information about future direction, only about the levels of volatility.
Conclusion
Bollinger Bands are a versatile tool that can be used in a variety of trading strategies. They can help traders identify potential buy and sell signals, monitor changes in volatility, and visually analyze the price trends. However, like all trading tools, they should be used in conjunction with other technical analysis tools and not relied upon solely for decision-making.


