Recognizing Double Tops and Bottoms in Trading
Trading in the financial markets involves a lot of analysis, strategy, and understanding of patterns. One of the most important patterns that traders often look out for are the double tops and bottoms. These patterns can provide insightful information about potential reversals in the market. This article will guide you on how to recognize these important patterns.
What are Double Tops and Bottoms?
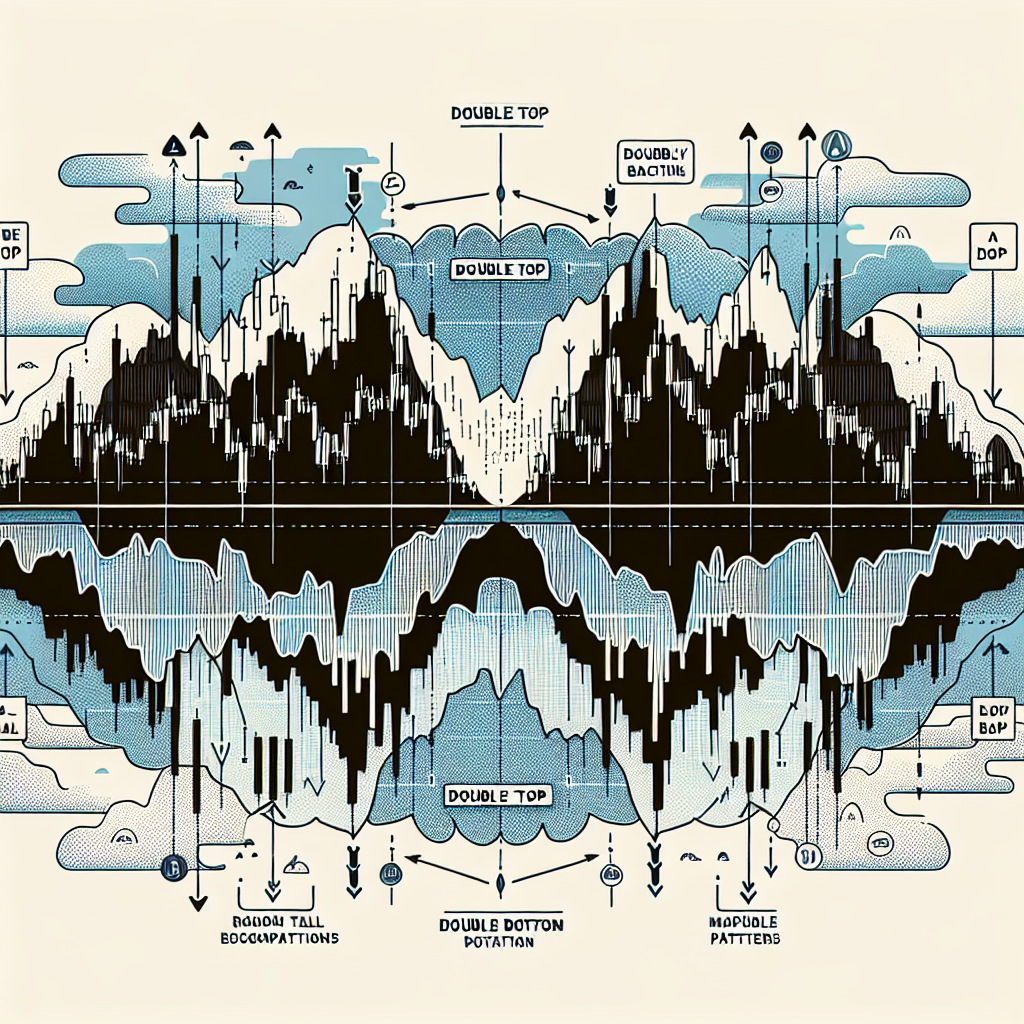
Double tops and bottoms are chart patterns that are used in technical analysis to predict potential reversals in the price direction. These patterns occur when the price of an asset hits the same high or low point twice, without being able to break through.
Double Tops
A double top is a bearish reversal pattern that is formed after an uptrend. It appears as two consecutive peaks that are roughly equal, with a moderate trough in-between. This pattern indicates that the price is struggling to break through a certain resistance level.
Double Bottoms
Conversely, a double bottom is a bullish reversal pattern that is formed after a downtrend. It appears as two consecutive troughs that are roughly equal, with a moderate peak in-between. This pattern indicates that the price is struggling to break through a certain support level.
Recognizing Double Top Patterns
Recognizing a double top pattern involves a few steps:
Step 1: Identify an Uptrend
The first step is to identify an uptrend. This is typically characterized by higher highs and higher lows.
Step 2: Spot the Two Peaks
The next step is to spot two peaks that are roughly equal in price. These peaks should be separated by a moderate trough, which forms the neckline of the pattern.
Step 3: Confirmation
The pattern is confirmed when the price falls below the neckline after forming the second peak. This indicates that the price is likely to continue falling.
Recognizing Double Bottom Patterns
Recognizing a double bottom pattern also involves a few steps:
Step 1: Identify a Downtrend
The first step is to identify a downtrend. This is typically characterized by lower highs and lower lows.
Step 2: Spot the Two Troughs
The next step is to spot two troughs that are roughly equal in price. These troughs should be separated by a moderate peak, which forms the neckline of the pattern.
Step 3: Confirmation
The pattern is confirmed when the price rises above the neckline after forming the second trough. This indicates that the price is likely to continue rising.
Conclusion
Recognizing double tops and bottoms can be a valuable tool for traders. These patterns can provide important clues about potential reversals in the market, helping traders to make more informed decisions. However, like any trading strategy, it’s important to use these patterns in conjunction with other forms of analysis to increase the chances of success.


