Understanding Fibonacci Retracement Levels
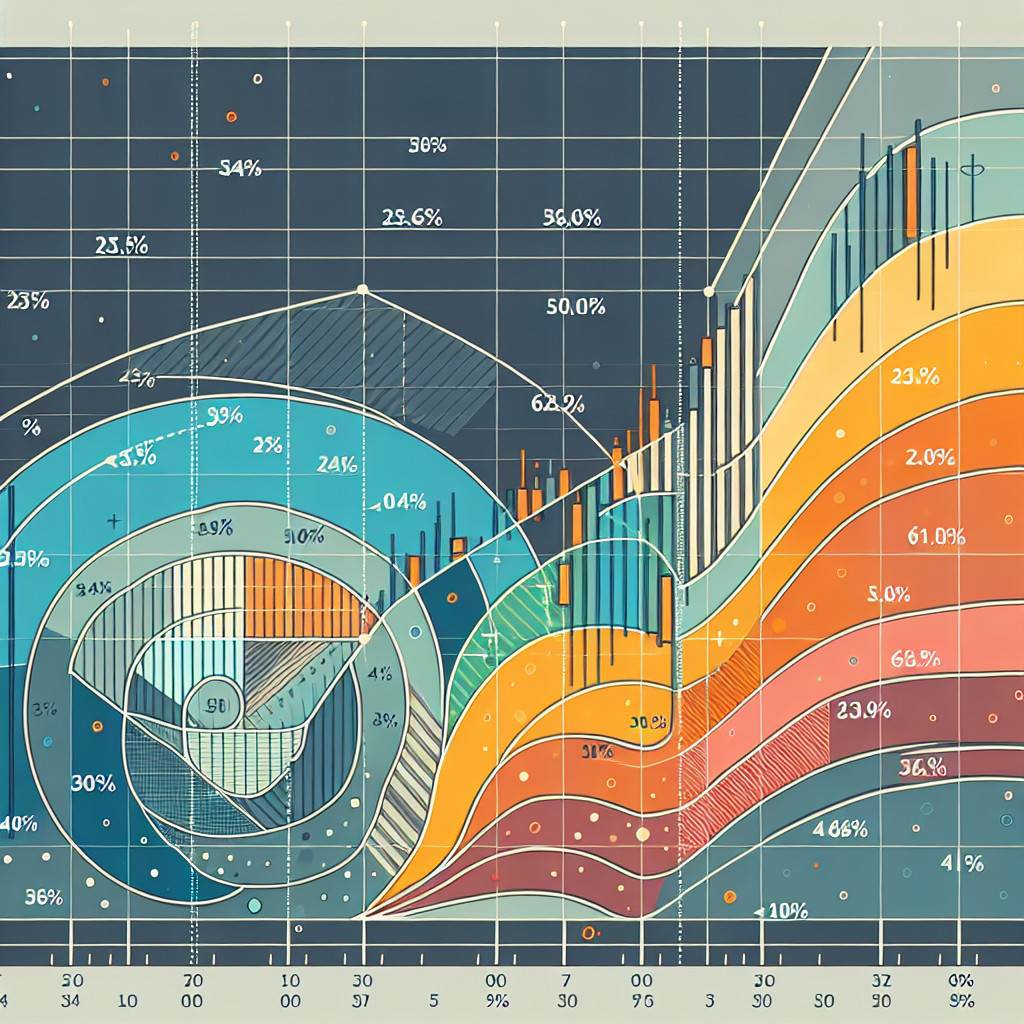
Fibonacci retracement levels are a set of horizontal lines used in technical analysis that indicate where support and resistance are likely to occur. They are calculated by taking the vertical distance between an asset’s high and low prices and dividing this distance by key Fibonacci ratios.
Origins of Fibonacci Retracement Levels
The concept of Fibonacci retracement levels originates from Leonardo Fibonacci, a 13th-century Italian mathematician. Fibonacci introduced a sequence of numbers where each subsequent number is the sum of the two preceding ones, starting from 0 and 1. This sequence is known as the Fibonacci sequence.
In the context of trading and technical analysis, Fibonacci retracement levels are used to identify potential reversal points in the price of an asset. The main ratios used are 23.6%, 38.2%, 50%, 61.8%, and 100%.
How Fibonacci Retracement Levels Work
Step 1: Identify Swing Highs and Swing Lows
The first step in drawing Fibonacci retracement levels is to identify the most recent significant swing highs and swing lows. A swing high is a peak in the price chart, while a swing low is a trough.
Step 2: Draw the Fibonacci Levels
Once the swing highs and lows are identified, the next step is to draw the Fibonacci levels. This is done by drawing a vertical line between the identified swing high and swing low and then dividing this line using the Fibonacci ratios.
Step 3: Interpret the Levels
After the Fibonacci levels are drawn, they can be used to identify potential support and resistance levels. If the price of an asset retraces to a Fibonacci level and then starts to move in the original direction, this could indicate that the level is acting as support or resistance.
Practical Application of Fibonacci Retracement Levels
Fibonacci retracement levels are widely used in trading strategies. They are often used in conjunction with other technical indicators to confirm potential reversal points and set stop-loss and take-profit levels.
For instance, traders might look for a reversal candlestick pattern at a Fibonacci level to confirm a potential trade entry. They might also use the Fibonacci levels to set their stop-loss and take-profit levels. For example, if a trader enters a long trade at a 61.8% retracement level, they might set their stop-loss below this level and their take-profit at the 38.2% or 23.6% level.
Limitations of Fibonacci Retracement Levels
While Fibonacci retracement levels can be a useful tool in technical analysis, they are not infallible. Like all technical indicators, they should be used in conjunction with other forms of analysis and should not be relied upon exclusively.
Furthermore, drawing Fibonacci levels can be somewhat subjective. Different traders might identify different swing highs and swing lows, leading to different Fibonacci levels. Therefore, it’s important to use a consistent approach when drawing these levels.
In conclusion, Fibonacci retracement levels are a valuable tool for traders, providing potential insights into price reversals and support and resistance levels. However, like all tools, they should be used as part of a broader trading strategy and not relied upon exclusively.


