Elliott Wave Forecasting Models
The Elliott Wave Principle is a form of technical analysis that finance traders use to analyze financial market cycles and forecast market trends by identifying extremes in investor psychology, highs and lows in prices, and other collective factors. This article will delve into the specifics of the Elliott Wave forecasting models, their history, how they work, and their application in the financial markets.
History of the Elliott Wave Principle
The Elliott Wave Principle was developed by Ralph Nelson Elliott in the late 1920s. Elliott discovered that stock markets, thought to behave in a somewhat chaotic manner, in fact traded in repetitive cycles. He proposed that market prices unfold in specific patterns, which practitioners today call Elliott waves, or simply waves. Elliott’s theory is somewhat complex, but its basic premise is that market behaviors can be predicted because they move in repetitive cycles resulting from investors’ reactions to external influences, or mass psychology that switches from pessimism to optimism and back in a natural sequence.
Understanding the Elliott Wave Forecasting Models
The Basic Structure
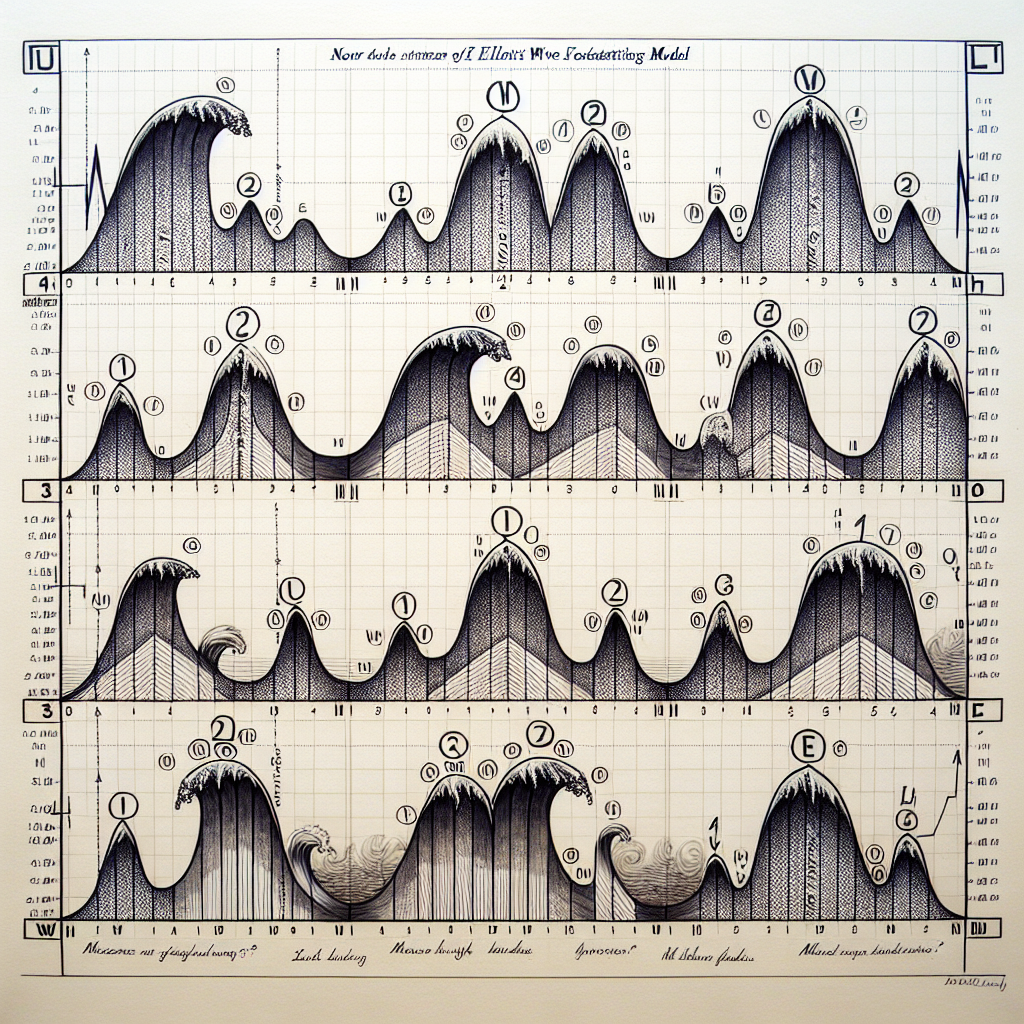
The basic Elliott Wave structure consists of a five-wave sequence for market advances and a three-wave sequence for market declines. This is often referred to as the “5-3 move”. The 5-3 move completes a cycle. This cycle is then repeated to create larger versions of the same patterns, in a fractal nature.
Impulse Waves and Corrective Waves
The five-wave sequence is made up of three “impulse” waves, interspersed with two “corrective” waves. In other words, during a bull market, the three impulse waves (1, 3, and 5) represent the periods where the prices are going up, while the two corrective waves (2 and 4) represent periods where prices are going down. Conversely, during a bear market, the impulse waves are down, and the corrective waves are up.
Application of Elliott Wave Forecasting Models in Financial Markets
Traders and investors use the Elliott Wave forecasting models to analyze the markets and predict future price movements based on past patterns. The models can be used in any financial market, and on any timeframe, from intraday to long-term investment horizons.
Identifying Market Extremes
One of the key benefits of using the Elliott Wave Principle is its ability to identify market extremes. By studying the patterns of the Elliott Wave, traders can identify when the market sentiment is likely to change. This can provide valuable clues about potential market tops and bottoms, helping traders to enter and exit trades at the most opportune times.
Managing Risk
The Elliott Wave Principle can also be used as a risk management tool. By identifying key levels where the expected wave pattern would be invalidated, traders can set stop losses accordingly, helping to limit potential losses if the market doesn’t move as expected.
Conclusion
While the Elliott Wave forecasting models are not foolproof, they provide a way for traders to forecast market trends by analyzing the cyclical patterns that markets tend to follow. By understanding these patterns and the psychology behind them, traders can make more informed decisions and better manage their risk.


