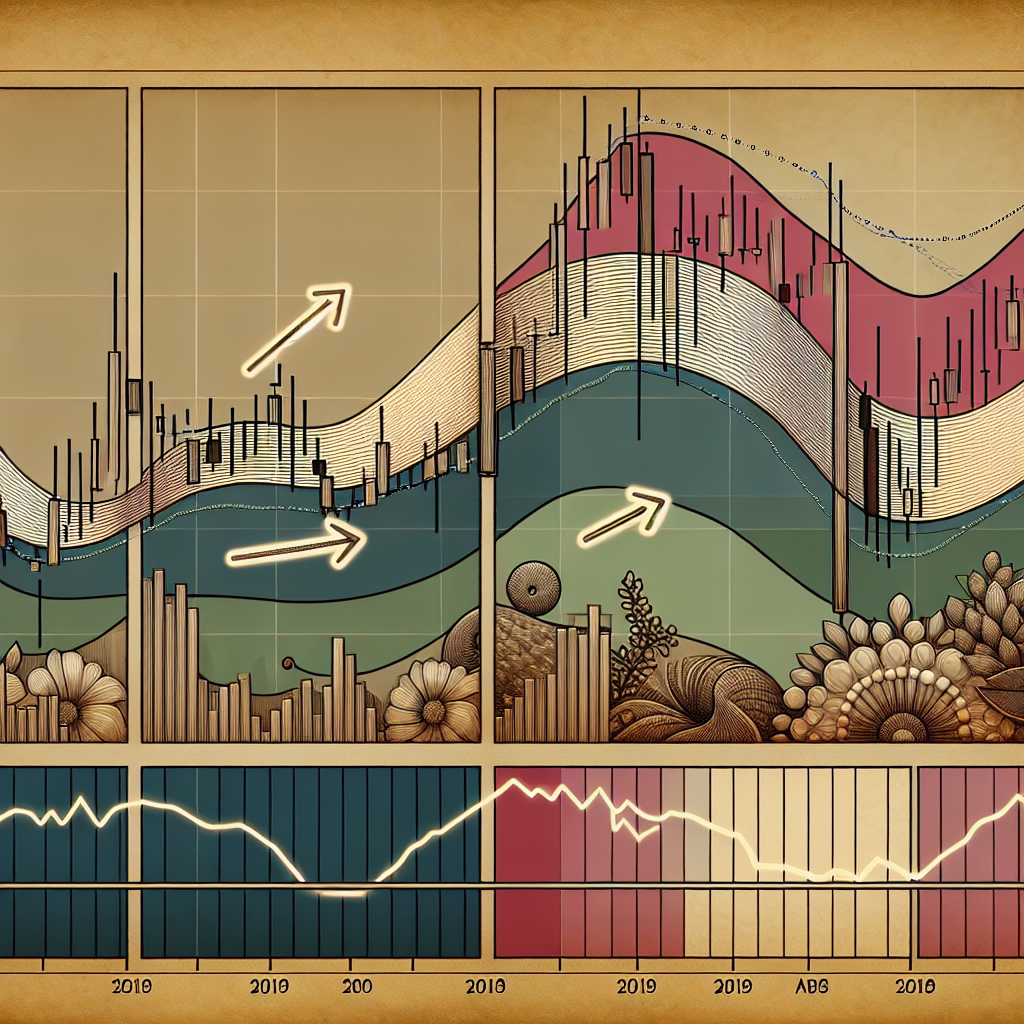
Trend Line Drawing Methods
Introduction
A trend line, also known as a line of best fit, is a tool used by traders and investors to help identify the prevailing direction of price. Trend lines are a cornerstone of technical analysis and can be used on any timeframe, from one minute to weekly and yearly charts. They can be used to identify potential areas of price reversal or continuation, to set stop losses or target prices, and to generate trade signals. There are several methods to draw trend lines. This article will explore the most commonly used methods.
Method 1: Using Two Highs or Two Lows
This is the most basic and commonly used method to draw a trend line. It involves using two highs (for a downtrend line) or two lows (for an uptrend line).
Steps:
- Identify two significant highs or lows on the chart.
- Draw a line connecting these two points.
- Extend this line to the right to create the trend line.
This method is straightforward and easy to implement. However, it may not always accurately represent the trend, especially in volatile markets.
Method 2: Using Three Points
This method is a bit more advanced and requires the identification of three points: two highs and a low (for a downtrend line) or two lows and a high (for an uptrend line).
Steps:
- Identify two significant highs and a significant low, or two significant lows and a significant high.
- Draw a line connecting the two highs, then extend it downwards to the low, or draw a line connecting the two lows, then extend it upwards to the high.
- Extend this line to the right to create the trend line.
This method is more reliable than the two-point method, as it takes into account more data. However, it can still be influenced by market volatility.
Method 3: Using Multiple Points
This method involves using multiple points to draw the trend line, making it the most accurate but also the most complex method.
Steps:
- Identify multiple significant highs or lows on the chart.
- Draw a line that best fits these points. This line may not touch all the points, but it should be as close as possible to most of them.
- Extend this line to the right to create the trend line.
This method is the most accurate, but it also requires the most skill and experience to implement correctly. It is best used by experienced traders and investors.
Conclusion
Trend lines are a powerful tool in technical analysis, helping traders and investors to identify potential areas of price reversal or continuation, set stop losses or target prices, and generate trade signals. The three methods described in this article – using two points, three points, or multiple points – each have their own strengths and weaknesses. Traders and investors should choose the method that best fits their trading style and risk tolerance.


