Introduction to RSI and Market Analysis
The Relative Strength Index (RSI) is a momentum oscillator that measures the speed and change of price movements. It is one of the most popular technical indicators used by traders to predict future market trends and determine potential buy and sell signals. This article will delve into how traders can use RSI strategies for effective market analysis.
Understanding the Basics of RSI
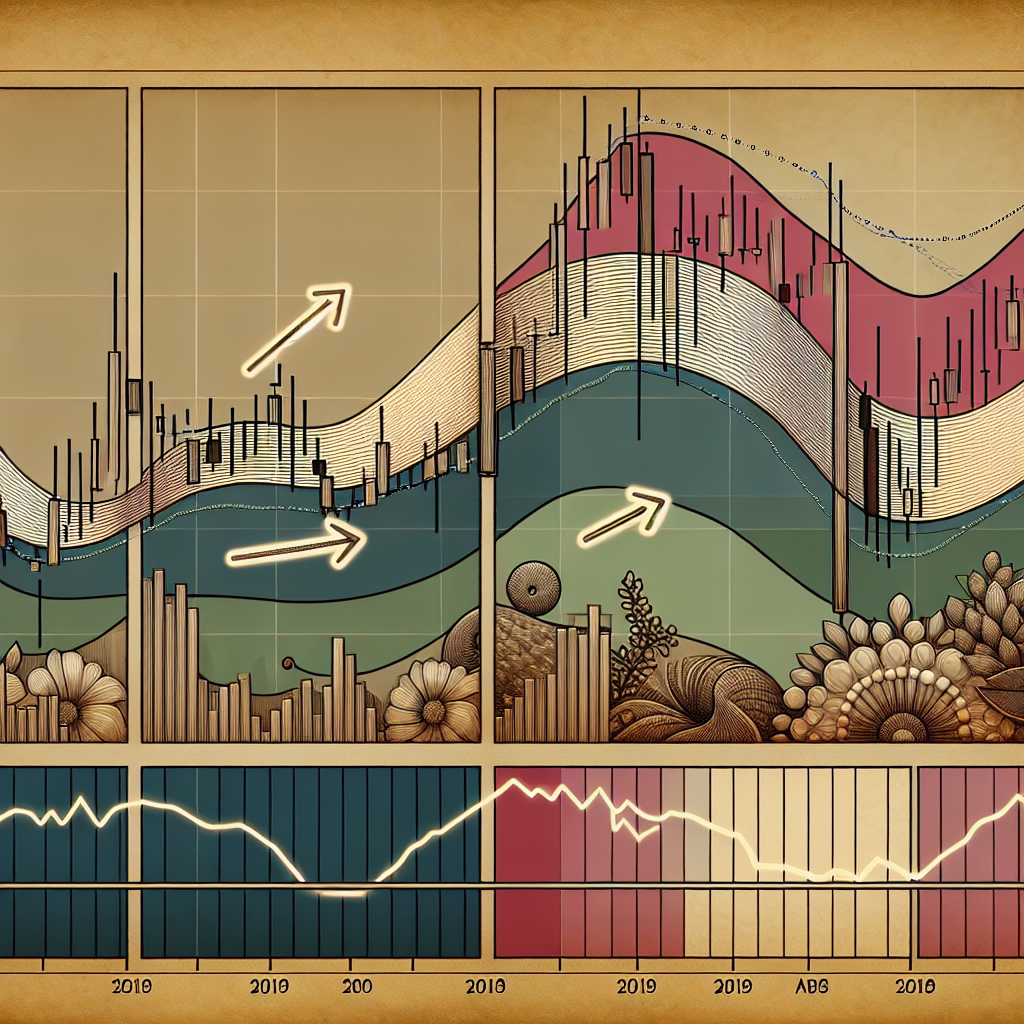
Before diving into RSI strategies, it’s important to understand the basics of the RSI. Developed by J. Welles Wilder Jr., the RSI is represented as a line graph that moves between two extremes, typically between 0 and 100. A reading above 70 is generally considered overbought, indicating that a price correction may be imminent, while a reading below 30 is usually viewed as oversold, suggesting a potential price bounce.
RSI Calculation
The RSI is calculated using the following formula:
RSI = 100 – (100 / (1 + RS))
Where RS (Relative Strength) is the average gain divided by the average loss over a specified period, usually 14 periods.
RSI Trading Strategies
There are several ways traders can use the RSI for market analysis. Here are some of the most effective strategies:
Overbought and Oversold Levels
One of the simplest ways to use the RSI is by identifying overbought and oversold levels. When the RSI crosses above 70, it may indicate that the asset is overbought and a sell-off could be imminent. Conversely, if the RSI dips below 30, it suggests that the asset is oversold and a price increase may be on the horizon.
RSI Divergences
A divergence occurs when the price of an asset and the RSI are moving in opposite directions. This could be a strong signal that the current trend is weakening and a price reversal could be imminent.
RSI Swing Rejections
Another strategy involves identifying swing rejections. This happens when the RSI breaks above 70, pulls back, bounces, fails to exceed 70, and then breaks its prior low. It’s the mirror opposite for a bullish swing rejection.
RSI Limitations
While the RSI is a powerful tool for market analysis, it’s not without its limitations. For instance, during strong trending markets, the RSI can remain overbought or oversold for extended periods, leading to false signals. Moreover, like all technical indicators, the RSI should not be used in isolation but in conjunction with other market analysis tools to increase the accuracy of trading signals.
Conclusion
The Relative Strength Index (RSI) is an invaluable tool for traders, providing insights into market conditions that may not be immediately apparent from price action alone. By understanding how to effectively interpret and apply the RSI, traders can enhance their market analysis and make more informed trading decisions. However, it’s crucial to remember that no single indicator should be used in isolation, and the RSI is no exception. Always corroborate RSI signals with other technical analysis tools and market indicators for the best results.