Mastering RSI for Market Momentum Analysis 0 (0)

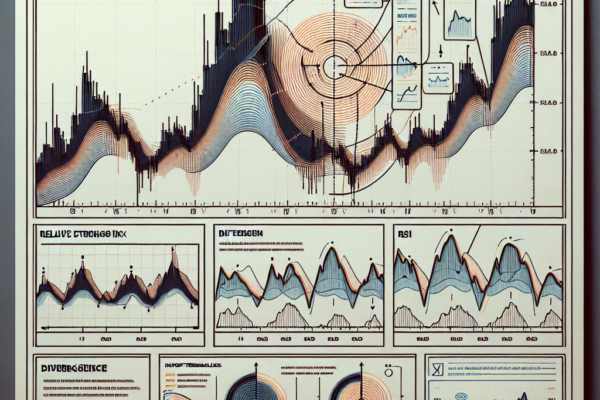
Introduction to the Relative Strength Index (RSI) The Relative Strength Index (RSI) is a momentum oscillator that measures the speed and change of price movements. Developed by J. Welles Wilder in 1978, RSI oscillates between zero and 100. Traditionally, the RSI is considered overbought when above 70 and oversold when below 30. This indicator can…

Read More

Exploring Dow Theory in Market Forecasting 0 (0)

Introduction to Dow Theory Dow Theory is a fundamental concept in the field of market analysis and forecasting, forming the cornerstone of technical analysis. Developed by Charles H. Dow, co-founder of Dow Jones & Company, this theory presents a methodical way of understanding market movements. It is not merely a tool for predicting stock prices…

Read More

Mastering Advanced Ichimoku Cloud Trading Strategies 0 (0)

# Advanced Ichimoku Cloud Strategies The Ichimoku Cloud, or Ichimoku Kinko Hyo, is a comprehensive indicator that defines support and resistance, identifies trend direction, gauges momentum, and provides trading signals. It is a favored instrument among many traders for its ability to consolidate multiple analyses into a single glance. While the basics of the Ichimoku…

Read More

The Essential Guide to Backtesting Trading Indicators 0 (0)

# Backtesting Trading Indicators: A Comprehensive Guide Making informed trading decisions is crucial for success in the financial markets. One effective way traders enhance their strategy is by backtesting trading indicators. Backtesting is the process of testing a trading strategy or model on historical data to see how it would have performed in the past….

Read More

Enhancing Trading with Support and Resistance Strategies 0 (0)

Mastering Support and Resistance Level Strategies in Trading Understanding how to effectively use support and resistance levels can significantly improve your trading strategy. These levels are among the most fundamental concepts in technical analysis, providing insights into potential reversal points on price charts. By mastering these strategies, traders can better predict price movements, making more…

Read More

Mastering the Art of Identifying RSI Divergence 0 (0)

Understanding RSI Divergence RSI, or Relative Strength Index, is a momentum oscillator that measures the speed and change of price movements. It operates on a scale from 0 to 100, aiming to indicate overbought or oversold conditions. However, one of its most significant aspects for traders is its ability to highlight divergence. RSI divergence can…

Read More

Unlocking the Potential of Trading with MACD Crossovers 0 (0)

Mastering Trading with MACD Crossovers The Moving Average Convergence Divergence (MACD) is a trend-following momentum indicator that shows the relationship between two moving averages of a security’s price. It is a popular tool among traders due to its effectiveness in identifying potential buy or sell signals. One of the key strategies used with the MACD…

Read More

Mastering MACD Histogram Interpretations for Trading 0 (0)

Understanding MACD Histogram Interpretations Introduction to MACD Histogram The Moving Average Convergence Divergence (MACD) histogram is a popular technical indicator used by traders and investors to gauge market momentum and potential price direction. It operates by calculating the difference between a fast-moving average and a slow-moving average, distilling this information into a visual histogram format….

Read More

Mastering Double Tops and Bottoms in Trading Charts 0 (0)

# Recognizing Double Tops and Bottoms in Market Charts Traders and investors use various chart patterns to predict future market movements. Among the most well-known patterns are double tops and double bottoms. These patterns signify potential reversals in the market, making them invaluable tools for those looking to capitalize on shifting trends. This article provides…

Read More
Back To Top