Mastering the Bollinger Band Squeeze Technique
The Bollinger Band squeeze technique is a powerful tool used by traders to identify potential market breakouts. By interpreting the convergence and divergence of these bands, traders can make educated guesses on the future direction of the market. This technique, named after its creator John Bollinger, utilizes volatility and relative price levels to indicate buying or selling opportunities. In this article, we’ll explore how to effectively utilize the Bollinger Band squeeze in your trading strategy.
Understanding Bollinger Bands
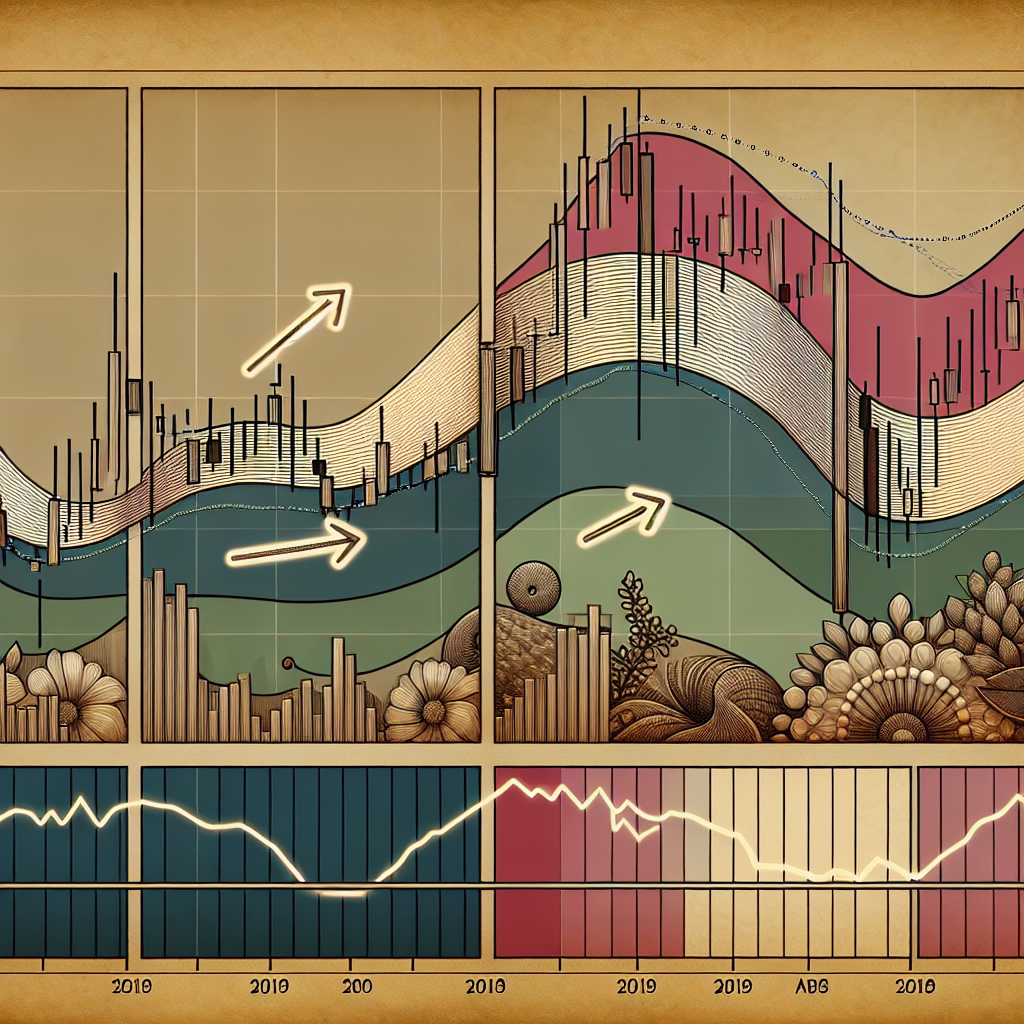
Bollinger Bands consist of three lines: the middle band, which is a simple moving average (SMA) typically set at 20 periods; and two outer bands that are placed two standard deviations away from the middle band, both above and below it. These bands expand and contract based on market volatility. When the market is volatile, the bands widen; and when the market is stable, the bands contract.
What is the Bollinger Band Squeeze?
The Bollinger Band squeeze occurs when the bands contract and come closer together, indicating decreased volatility and signifying that the market is consolidating or “squeezing”. This squeeze is viewed by traders as a potential precursor to a significant market breakout, as periods of low volatility often precede periods of high volatility, offering potential high-reward trading opportunities.
Identifying a Bollinger Band Squeeze
Step 1: Look for Narrow Bands
To identify a Bollinger Band squeeze, the first step is to visually inspect the Bollinger Bands for a period of narrowing. This can be observed when the upper and lower bands converge towards the moving average line, signaling decreased market volatility.
Step 2: Check the Duration
It’s essential to consider the duration of the squeeze. A bona fide squeeze is one that lasts for a short to moderate timeframe. Extended periods of squeeze may not lead to significant breakouts.
Step 3: Volume and Confirmatory Indicators
While the Bollinger Band squeeze indicates potential market movement, volume indicators and other confirmatory analysis tools should be used to predict the breakout direction. An increase in volume often accompanies a true breakout.
Trading the Squeeze
Entering a Trade
Once a Bollinger Band squeeze is identified, and potential breakout direction is confirmed through other indicators and volume analysis, traders can look to enter a trade. Entry points are usually set after the price breaks out of the squeeze pattern, above the upper band for a bullish breakout or below the lower band for a bearish breakout.
Setting Stop Losses and Targets
Appropriate risk management strategies are crucial when trading the squeeze. Setting stop losses slightly above or below the breakout point can protect against false breakouts. Targets can be set by measuring the width of the prior consolidation area and projecting that from the breakout point.
Conclusion
The Bollinger Band squeeze technique is an effective strategy for identifying potential market breakouts. By analyzing the contraction and expansion of the Bollinger Bands, traders can determine the likely direction and magnitude of future price movements. However, like all trading strategies, it’s important to incorporate other analytical tools and indicators to confirm potential breakouts and manage risk appropriately.
With practice and a sound understanding of Bollinger Bands and market volatility, the squeeze technique can become a valuable part of a trader’s toolkit for navigating the complexities of the market.