Elliott Wave Forecasting Models
Introduction to Elliott Wave Theory
Elliott Wave Theory is a form of technical analysis that finance traders use to analyze financial market cycles and forecast market trends by identifying extremes in investor psychology, highs and lows in prices, and other collective factors. Developed by Ralph Nelson Elliott in the 1930s, the theory proposes that the market moves in repetitive cycles, which reflect the emotions of investors caused by outside influences or the predominant psychology of the masses at the time. Elliott identified that these market cycles resulted from investors’ reactions to various macroeconomic stimuli, and he described these movements in what he called “waves”.
Basics of Elliott Wave Theory
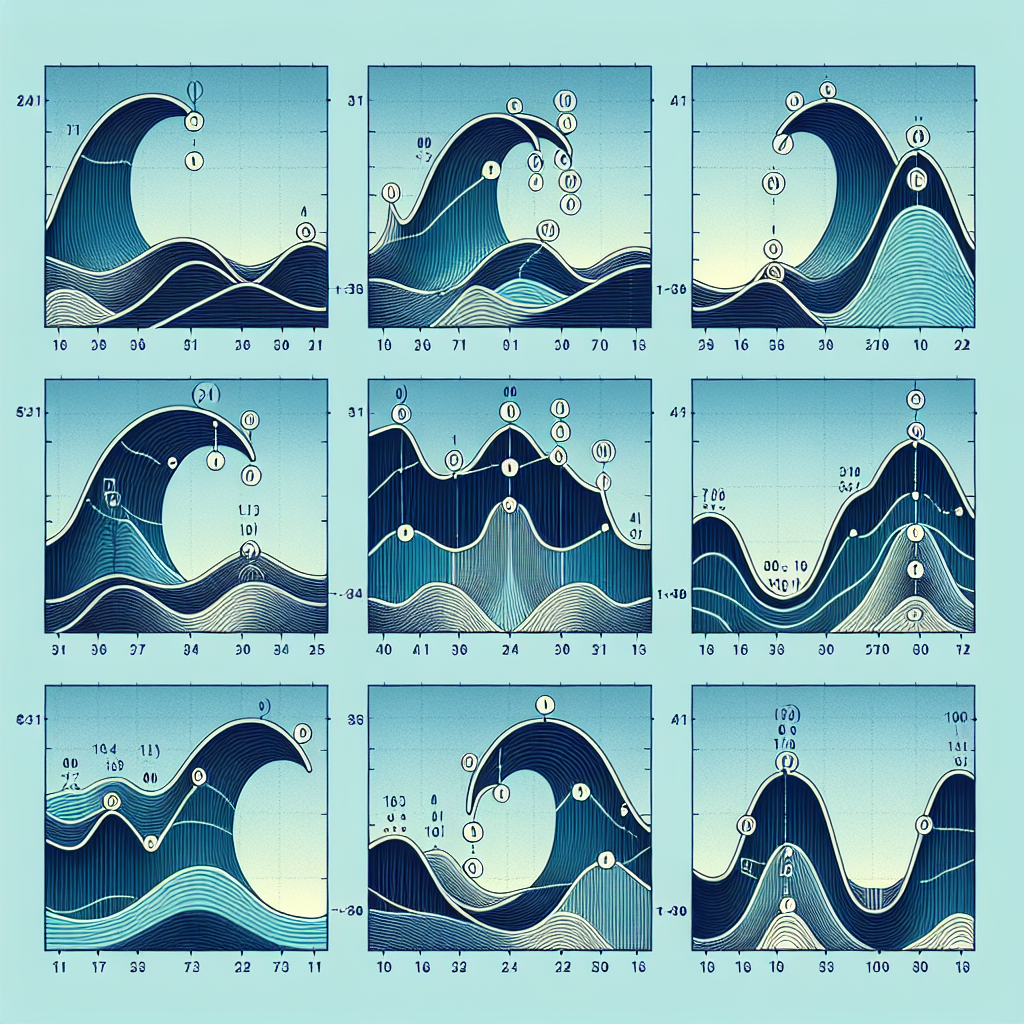
The Elliott Wave Theory suggests that a market trend follows a pattern of five waves in the direction of the trend followed by three corrective waves (a 5-3 move). This pattern is considered to repeat itself in fractal waves, which implies that the structure is similar across different time scales. These waves are identified with numbers and letters (1-2-3-4-5 for impulse waves and A-B-C for corrective waves).
Impulse Waves
Impulse waves consist of five sub-waves that move in the same direction as the trend of the next larger size. They play a key role in determining market direction and are usually marked by an increase in volume during their formation.
Corrective Waves
Corrective waves, on the other hand, consist of three sub-waves that move in the opposite direction to the trend of the next larger size. They are usually more difficult to identify and can manifest in different forms, including zigzags, flats, or complex combinations.
Forecasting with Elliott Wave Theory
Elliott Wave forecasting involves identifying the wave patterns in market price data and predicting future price movements based on the theory’s guidelines. A deep understanding of wave patterns allows analysts to forecast market trends, entry and exit points, and potential price targets.
Identifying Elliott Wave Patterns
To forecast market trends using Elliott Wave Theory, one must first identify the starting point of the wave count. This involves determining whether the market is currently in an impulse phase or a corrective phase. Analysts look for a series of peaks and troughs that align with the Elliott Wave structure and use these points as markers for potential wave counts.
Applying Fibonacci Ratios
Fibonacci ratios play a crucial role in Elliott Wave forecasting. Many Elliott Wave practitioners use Fibonacci ratios to determine potential reversal points and forecast the extent of waves. For example, it is common to find Fibonacci retracement levels acting as support or resistance levels within wave patterns.
Limitations of Elliott Wave Theory
While Elliott Wave Theory is a powerful tool for forecasting market trends, it is not without its criticisms and limitations. One of the primary challenges in applying Elliott Wave Theory is its subjectivity; different analysts can interpret wave patterns differently, leading to varied forecasts. Additionally, the theory’s complexity and the need for significant experience in wave identification can be daunting for newcomers.
Conclusion
The Elliott Wave Theory offers a comprehensive framework for understanding market psychology and forecasting market trends. Despite its complexity and subjectivity, many traders and analysts find the theory invaluable for making informed trading decisions. With practice and a deep understanding of wave patterns, Elliott Wave forecasting can be a robust addition to any trader’s or investor’s toolkit.