Bollinger Band Squeeze Technique
In the world of technical analysis, there are numerous strategies traders use to determine the best time to enter or exit a trade. One such strategy is the Bollinger Band squeeze technique. This technique is based on the Bollinger Band indicator, which was developed by John Bollinger in the 1980s. In this article, we will delve deeper into what the Bollinger Band squeeze technique is, how it works, and how to use it in your trading strategy.
Understanding Bollinger Bands
Bollinger Bands are a type of statistical chart characterizing the prices and volatility over time of a financial instrument or commodity. They consist of a simple moving average (middle band), an upper band, and a lower band. The upper and lower bands are typically 2 standard deviations +/- from a 20-day simple moving average.
Volatility and Bollinger Bands
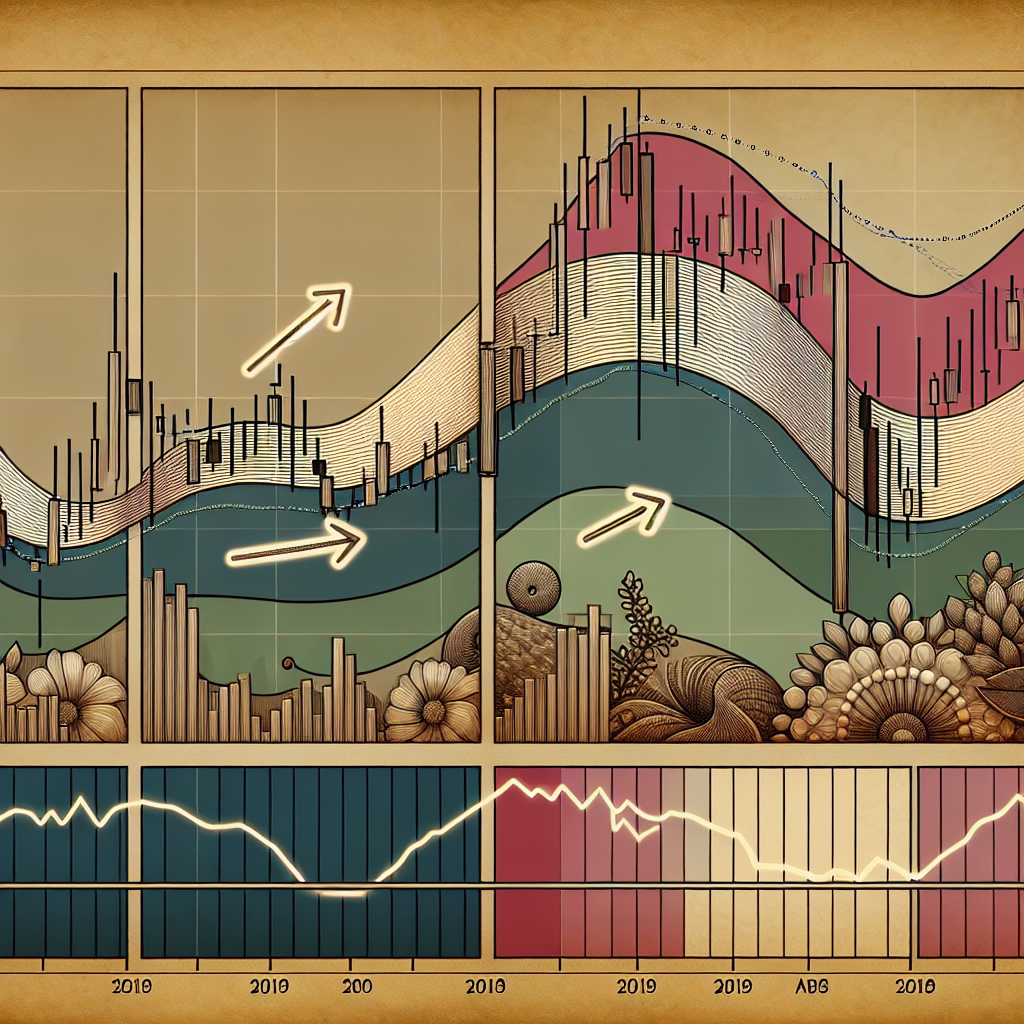
The bands widen and contract based on the volatility of the market. When the market is volatile, the bands widen, and when the market is quiet, the bands contract. The Bollinger Band squeeze occurs when volatility falls to low levels and the Bollinger Bands narrow.
What is a Bollinger Band Squeeze?
A Bollinger Band squeeze is a period of low volatility characterized by the narrowing of the bands. The squeeze is the calm before the storm, representing a potential signal that a significant price movement is on the horizon. The squeeze is determined by the bandwidth, which is the percentage difference between the upper and lower bands.
Significance of a Squeeze
The squeeze is significant because it signals a period of low volatility and potential future increased volatility. This potential volatility can result in significant price movements. However, the Bollinger Band squeeze does not tell us which direction the breakout will occur.
How to Use the Bollinger Band Squeeze Technique
The Bollinger Band squeeze technique can be used in conjunction with other technical analysis techniques to identify potential trading opportunities.
Step 1: Identify a Bollinger Band Squeeze
First, you need to identify a Bollinger Band squeeze on a chart. This occurs when the upper and lower bands come close together, indicating a period of low volatility.
Step 2: Look for a Breakout
After identifying a squeeze, the next step is to look for a breakout. This is when the price moves beyond the upper or lower band, indicating a potential significant price movement.
Step 3: Confirm the Breakout with Other Indicators
Before entering a trade, it’s important to confirm the breakout with other indicators. This could include a volume surge, momentum oscillators, or other technical indicators.
Step 4: Enter the Trade
Once the breakout is confirmed, you can enter the trade. If the price breaks above the upper band, you could enter a long position. If the price breaks below the lower band, you could enter a short position.
Step 5: Set a Stop Loss and Take Profit
Finally, it’s important to set a stop loss and take profit for your trade. This will protect your investment and lock in any potential profits.
Conclusion
The Bollinger Band squeeze technique is a powerful tool in a trader’s arsenal. By identifying periods of low volatility and potential breakouts, traders can position themselves for potential significant price movements. However, like all trading strategies, it’s important to use the Bollinger Band squeeze technique in conjunction with other technical analysis tools to confirm trading signals.


