Using MACD for Trade Signals
Introduction to MACD
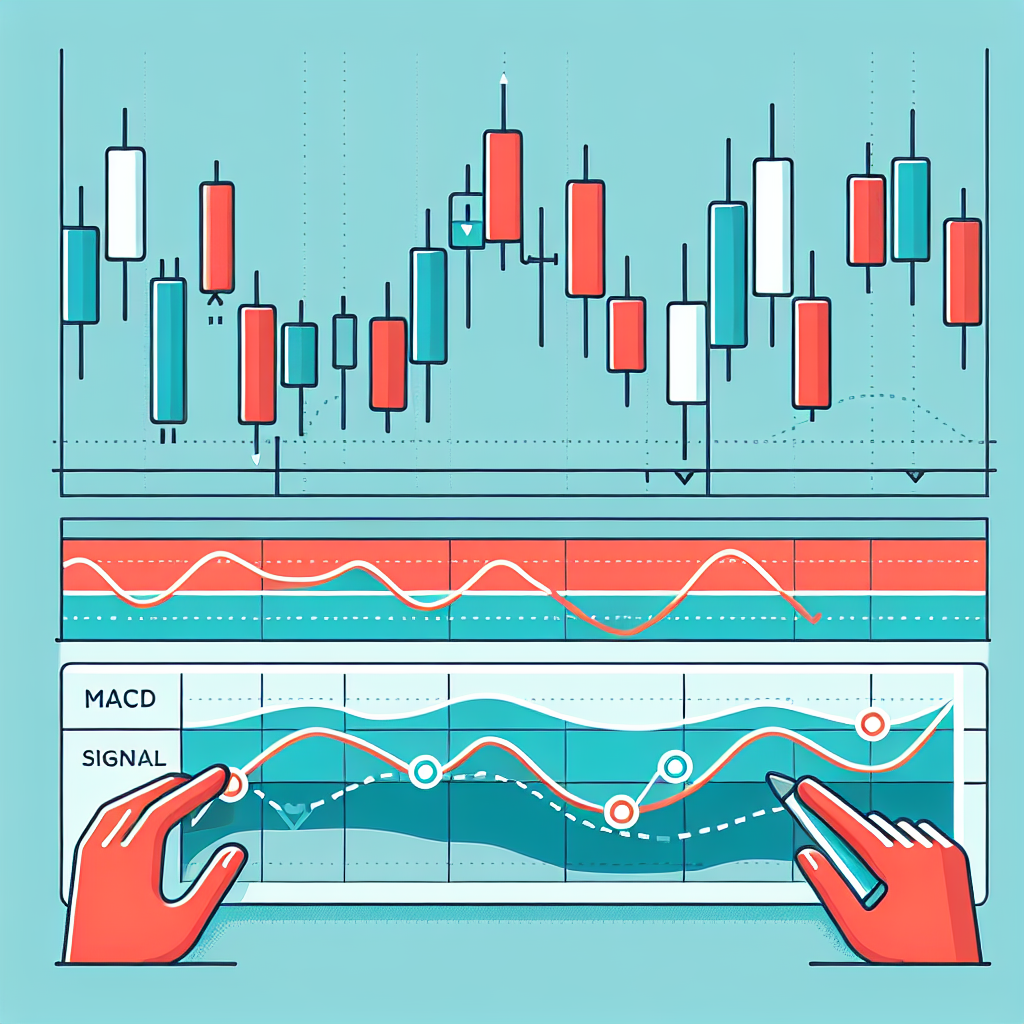
The Moving Average Convergence Divergence (MACD) is a popular trend-following momentum indicator that shows the relationship between two moving averages of a security’s price. The MACD is calculated by subtracting the 26-period Exponential Moving Average (EMA) from the 12-period EMA. A nine-day EMA of the MACD, called the “signal line,” is then plotted on top of the MACD line, which can function as a trigger for buy and sell signals.
Understanding MACD Signals
MACD signals are generated in several ways, but the most common ones are crossovers, divergences, and rapid rises/falls.
Crossovers
When the MACD falls below the signal line, it is a bearish signal, which indicates that it may be time to sell. Conversely, when the MACD rises above the signal line, it’s a bullish signal, which suggests that the price of the asset is likely to experience upward momentum. Some traders wait for confirmation, for instance, the next period’s price to move above the signal line before buying.
Divergences
A bullish divergence occurs when the MACD is making new highs while prices fail to reach new highs. This can often be a sign of a market bottom. A bearish divergence occurs when the MACD is making new lows while prices fail to reach new lows. Both of these divergences are most significant when they occur at relatively overbought/oversold levels.
Rapid Rises/Falls
If the MACD rises dramatically – that is, the shorter moving average pulls away from the longer-term moving average – it’s a signal that the security is overbought and will soon return to normal levels. Traders will often combine this with other indicators to increase signal accuracy.
How to Use MACD for Trade Signals
To use MACD for trade signals, follow the steps below:
Step 1: Plot MACD and Signal Line
First, plot the MACD line (12-period EMA minus the 26-period EMA) and the signal line (9-period EMA of the MACD line) on the same chart.
Step 2: Identify Potential Buy/Sell Signals
Next, identify potential buy and sell signals. A buy signal is generated when the MACD line crosses above the signal line, and a sell signal is generated when the MACD line crosses below the signal line.
Step 3: Consider Divergences and Rapid Rises/Falls
Consider other signals such as divergences and rapid rises/falls. If the MACD line is making new highs/lows but the price is not, it could indicate a market top or bottom. Similarly, if the MACD line rises or falls dramatically, it could indicate overbought or oversold conditions.
Step 4: Combine with Other Indicators
Finally, combine MACD signals with other technical analysis indicators to increase the accuracy of your predictions.
Conclusion
The MACD is a powerful trading tool that can help traders identify potential buy and sell opportunities. However, like all indicators, it is not infallible and should be used in conjunction with other technical analysis tools to increase the probability of success. It’s also important to remember that while MACD can provide a good indication of potential price movement, it does not guarantee it. As always, sound money management techniques should be used alongside any trading strategy.


