Introduction to Support and Resistance Zones
The financial market is a complex environment with various factors influencing the prices of assets. Among the most critical concepts in this field are support and resistance zones. Understanding these zones is fundamental to both novice and experienced traders, as they play a significant role in identifying potential trading opportunities.
Understanding Support and Resistance Zones
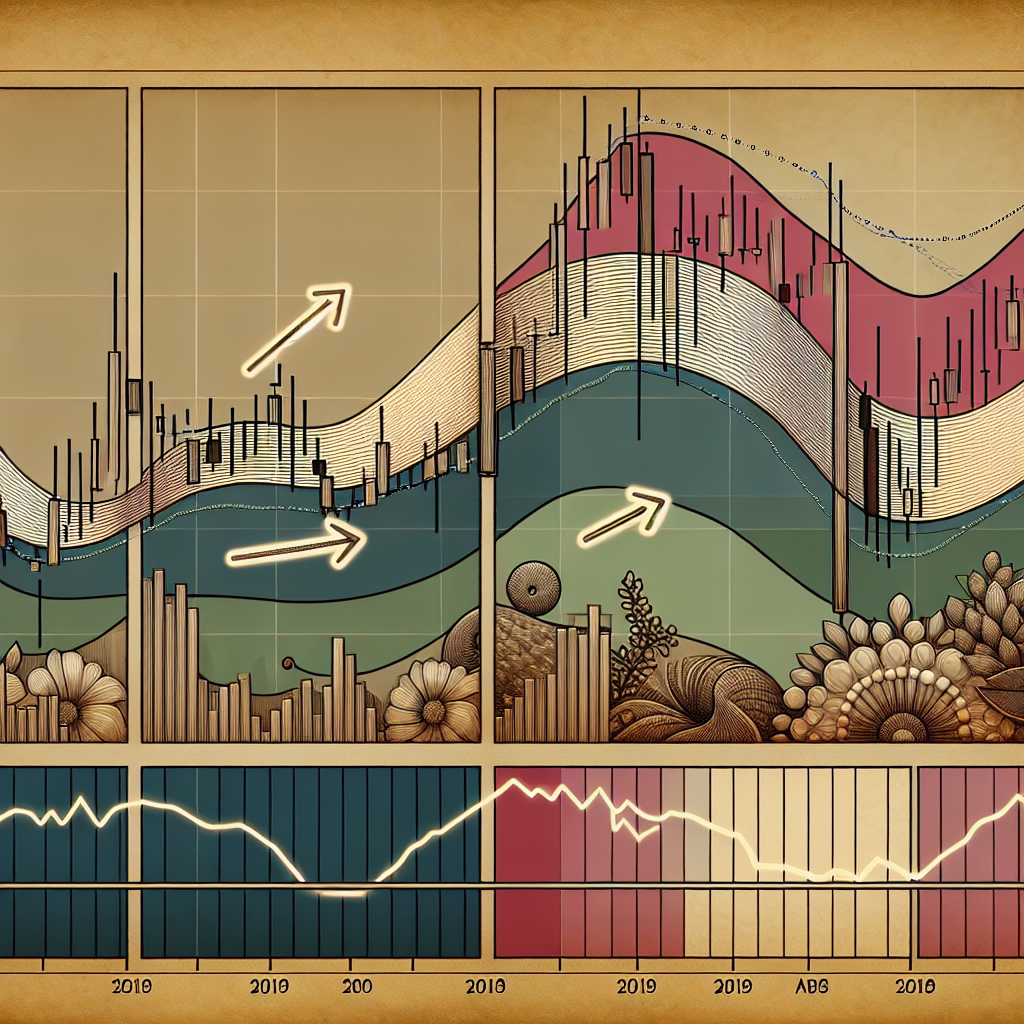
Support and resistance zones are price levels in a market where the price tends to stop and reverse. These zones help traders to predict the future movements of the market, and they are a crucial part of technical analysis.
Support Zones
A support zone is a price level at which a downtrend is expected to pause due to a concentration of demand. As the price of an asset gets closer to the support zone, it is generally believed that demand will exceed supply, preventing the price from falling further.
Resistance Zones
On the other hand, a resistance zone is a price level at which an uptrend is expected to pause due to a concentration of supply. As the price of an asset approaches the resistance zone, it is generally believed that supply will overcome demand, preventing the price from rising further.
Identifying Key Support and Resistance Zones
Identifying key support and resistance zones is crucial for making informed trading decisions. These zones can be identified using various methods, including chart patterns, trend lines, and moving averages.
Chart Patterns
One of the most common methods of identifying support and resistance zones is through chart patterns. Traders look for patterns such as double tops or bottoms, head and shoulders, and triangles, which often indicate the presence of these zones.
Trend Lines
Trend lines are another useful tool for identifying support and resistance zones. By connecting the highs and lows in a price chart, traders can identify potential zones where the price is likely to reverse.
Moving Averages
Moving averages can also be used to identify potential support and resistance zones. When the price of an asset is above the moving average, it can act as a support level. Conversely, when the price is below the moving average, it can act as a resistance level.
Conclusion
Understanding and identifying key support and resistance zones is a fundamental aspect of trading. By using tools such as chart patterns, trend lines, and moving averages, traders can make more informed decisions about when to enter or exit trades. However, it’s important to note that these zones are not foolproof and should be used in conjunction with other technical analysis tools and market indicators.


