Introduction to RSI and Market Analysis
The Relative Strength Index (RSI) is a popular and widely used technical analysis tool that measures the speed and change of price movements. It is typically used to identify overbought or oversold conditions in a market. The RSI oscillates between zero and 100 and is considered overbought when above 70 and oversold when below 30. These traditional levels can also be adjusted to better fit the security or analytical requirements. In this article, we will explore various RSI strategies for market analysis.
Understanding the RSI Indicator
The RSI is a momentum oscillator that measures the speed and change of price movements. It was developed by J. Welles Wilder and introduced in his 1978 book, “New Concepts in Technical Trading Systems.” The RSI is calculated using the following formula:
RSI = 100 – (100 / (1 + RS))
Where RS (Relative Strength) is the average gain divided by the average loss over a specified period.
Using RSI for Market Analysis
1. Identifying Overbought and Oversold Levels
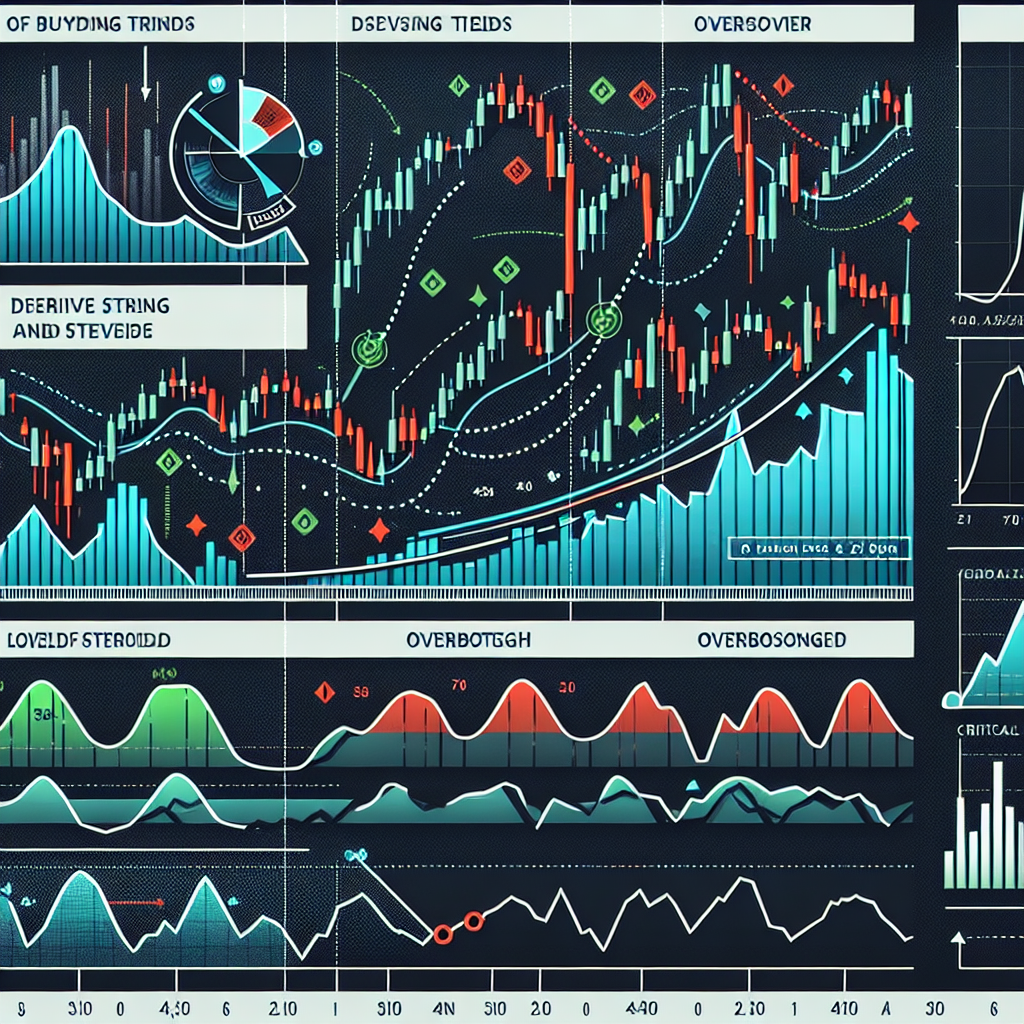
One of the most common uses of the RSI is to identify overbought and oversold levels. When the RSI exceeds 70, it indicates that a security may be getting overbought and could be primed for a trend reversal or corrective pullback in price. On the other hand, an RSI reading below 30 shows that the market may be oversold and could potentially be a spot where a price bounce may occur.
2. Spotting Divergences
Divergences occur when the price of a security moves in the opposite direction of the RSI. This can often be a reliable indicator of a potential reversal in the current trend. A bullish divergence occurs when the RSI creates an oversold reading followed by a higher low that matches correspondingly lower lows in the price. This indicates rising bullish momentum, and a break above upper trendline resistance could confirm the price reversal. Conversely, a bearish divergence occurs when the price creates a new high, but the RSI creates a lower high.
3. RSI Swing Rejections
Another trading technique involves looking for RSI swing rejections. This strategy involves looking for RSI to cross above 70 or below 30 and then reverse course. When RSI then turns down and falls below 70, a bearish signal is generated. Similarly, when RSI turns up and rises above 30, a bullish signal is generated.
Conclusion
The Relative Strength Index (RSI) is a versatile and widely used technical analysis tool that can help traders identify potential buy and sell opportunities. Like all technical analysis tools, it should be used in conjunction with other indicators and analysis techniques to increase the probability of accurate predictions and successful trades. Always remember that while these strategies can be helpful, they do not guarantee success and traders should always manage risk appropriately.


