Introduction
Trading in the financial markets is an intricate process that requires a deep understanding of various strategies and techniques. One of the most fundamental concepts in technical analysis is identifying key support and resistance zones. These zones are pivotal in making informed trading decisions and can significantly enhance your trading performance.
Understanding Support and Resistance Zones
Before we delve into how to identify these zones, it’s crucial to understand what they represent.
Support Zones
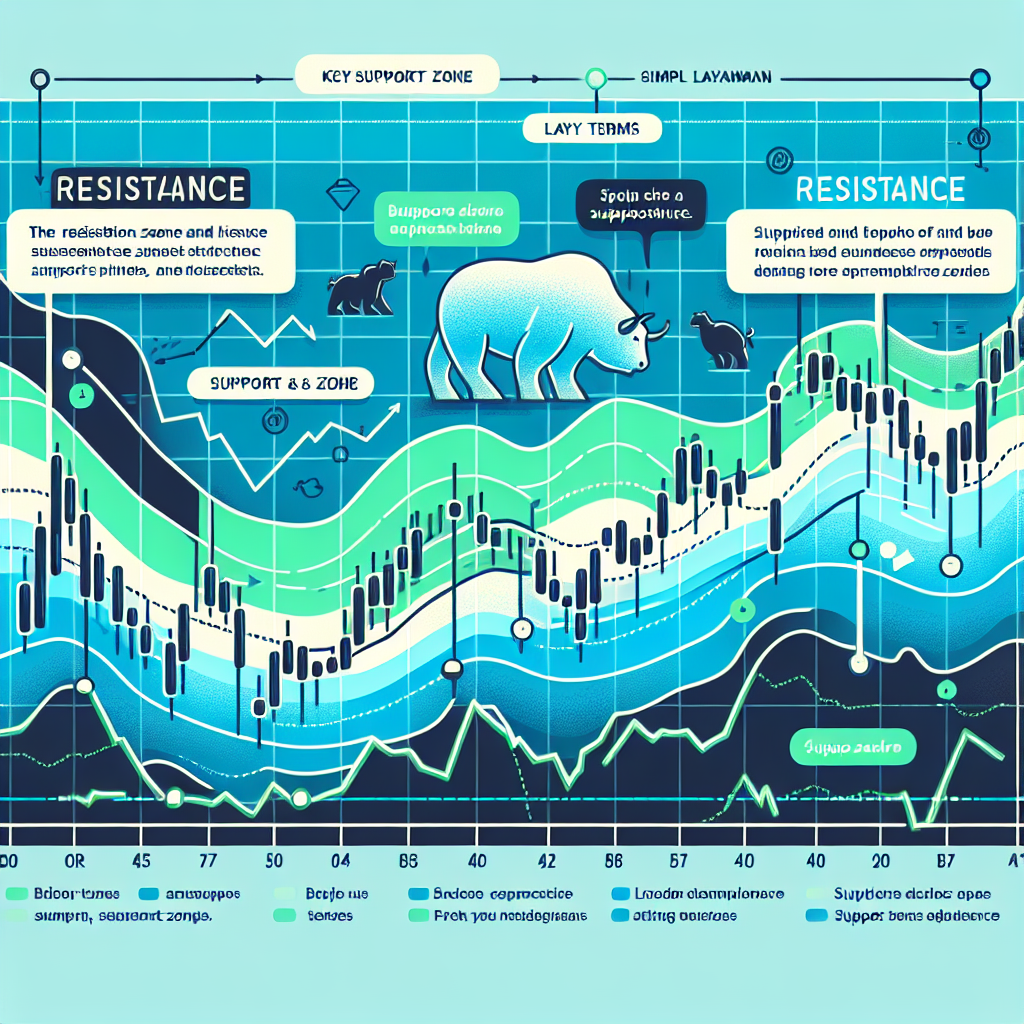
A support zone refers to a price level where the price tends to find support as it is falling. This means the price is more likely to “bounce” off this level rather than break through it. However, once the price has breached this level, it is likely to continue falling until meeting another support level.
Resistance Zones
A resistance zone, on the other hand, is a price level where the price tends to find resistance as it is rising. This implies that the price is more likely to “bounce” off this level rather than break through it. However, once the resistance level has been broken, it is likely to continue rising until it meets another resistance level.
Identifying Support and Resistance Zones
Now that we understand what these zones are, the next step is learning how to identify them on the chart.
Step 1: Select a Chart
The first step is to select a chart of the financial instrument you are interested in trading. This could be a currency pair, a stock, a commodity, or any other tradable asset. The chart should be set to a time frame that is relevant to your trading strategy.
Step 2: Identify Swing Highs and Swing Lows
The next step is to identify the swing highs and swing lows on the chart. A swing high is a price peak, and a swing low is a price trough. These points are where price changes direction, and they often coincide with support and resistance zones.
Step 3: Draw Horizontal Lines
Once you have identified the swing highs and swing lows, the next step is to draw horizontal lines at these levels. These lines represent potential support and resistance zones.
Step 4: Monitor Price Action
The final step is to monitor the price action as it approaches these levels. If the price bounces off a level, it confirms it as a support or resistance zone. If the price breaks through a level, it may signal a potential trend change.
Conclusion
Identifying key support and resistance zones is a critical skill for any trader. These zones provide valuable insight into potential turning points in the market, allowing traders to make more informed decisions. By understanding and applying this concept, you can significantly improve your trading performance.


