Identifying Common Chart Patterns
Chart patterns are foundational aspects of technical analysis in trading. They provide visual representations of price movements over a certain period. Traders use these patterns to predict future price movements, thus informing their investment decisions. This article will guide you through the process of identifying common chart patterns.
Understanding Chart Patterns
Chart patterns are graphical representations of price movements in a specific market. They can be identified in various types of charts such as line charts, bar charts, and candlestick charts. The patterns are formed by the fluctuating prices of an asset and can indicate whether the price is likely to continue or reverse its trend.
Common Types of Chart Patterns
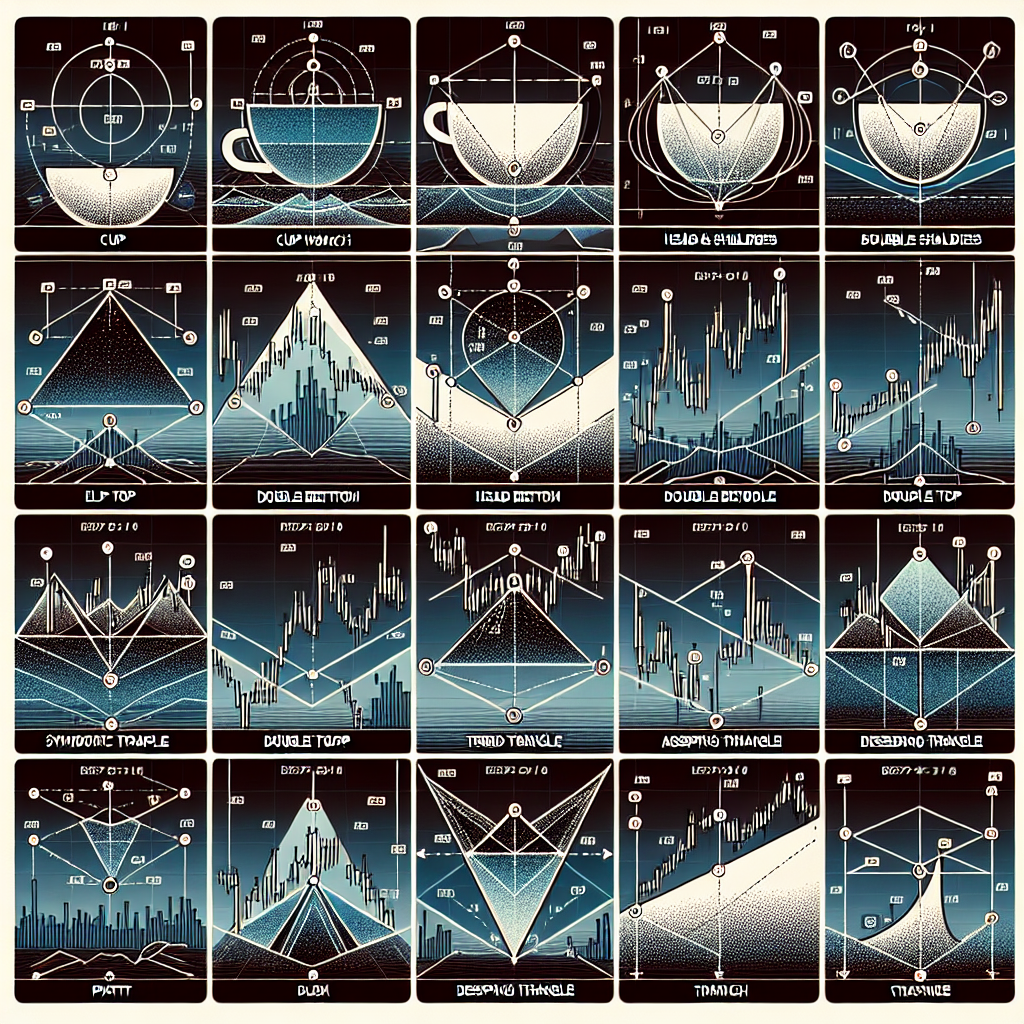
Head and Shoulders
This pattern is one of the most reliable trend reversal patterns. It consists of three peaks, with the middle peak (head) being the highest and the two either side (shoulders) being nearly equal in height. A line drawn at the lows of the two troughs forms the ‘neckline’. A break below the neckline signals a bearish reversal.
Double Top and Double Bottom
These are another set of reversal patterns. A double top forms after an uptrend and appears as two consecutive peaks of approximately the same height. A break below the support level following the second peak signals a bearish reversal. Conversely, a double bottom forms after a downtrend and appears as two consecutive troughs of approximately the same height. A break above the resistance level following the second trough signals a bullish reversal.
Triangles
Triangles are continuation patterns that can be ascending, descending, or symmetrical. Ascending triangles have a flat top and upward sloping bottom, indicating accumulating buying pressure. Descending triangles have a flat bottom and downward sloping top, indicating accumulating selling pressure. Symmetrical triangles have converging trend lines and indicate a period of consolidation before the price breaks out in the direction of the prevailing trend.
Flags and Pennants
These are short-term continuation patterns that mark a small consolidation before the previous move resumes. Flags look like small rectangles, while pennants are small symmetrical triangles.
Identifying Chart Patterns
Identifying chart patterns involves a keen eye and practice. Here are some steps to help you get started:
Step 1: Choose a Chart Type
Start by choosing a chart type that you’re comfortable with. Line charts are the simplest, while candlestick charts provide more detailed information.
Step 2: Identify the Trend
Before you can identify a chart pattern, you need to identify the prevailing trend. This can be an uptrend, downtrend, or sideways trend.
Step 3: Look for Patterns
Once you’ve identified the trend, look for patterns that indicate a continuation or reversal of the trend. Keep in mind that patterns are not always perfect, and it’s the overall shape and structure that matters.
Step 4: Confirm the Pattern
Confirmation of a pattern usually comes with a break of a key level such as the neckline in a head and shoulders pattern or the support/resistance level in a double top/bottom pattern. Volume can also help confirm a pattern. For example, volume should increase during the breakout in a flag or pennant pattern.
Conclusion
Chart patterns are a crucial tool in technical analysis, and understanding them can greatly improve your trading strategy. Remember, though, that no pattern is 100% reliable, and they should be used in conjunction with other indicators and analysis methods. With practice, you’ll become more adept at identifying and interpreting these patterns.


