Algorithmic Trading with Technical Indicators
Algorithmic trading, also known as automated trading, is a method of executing orders using automated pre-programmed trading instructions accounting for variables such as time, price, and volume. This type of trading was developed so traders can avoid human error and manage their portfolio more efficiently by ensuring faster execution of trades.
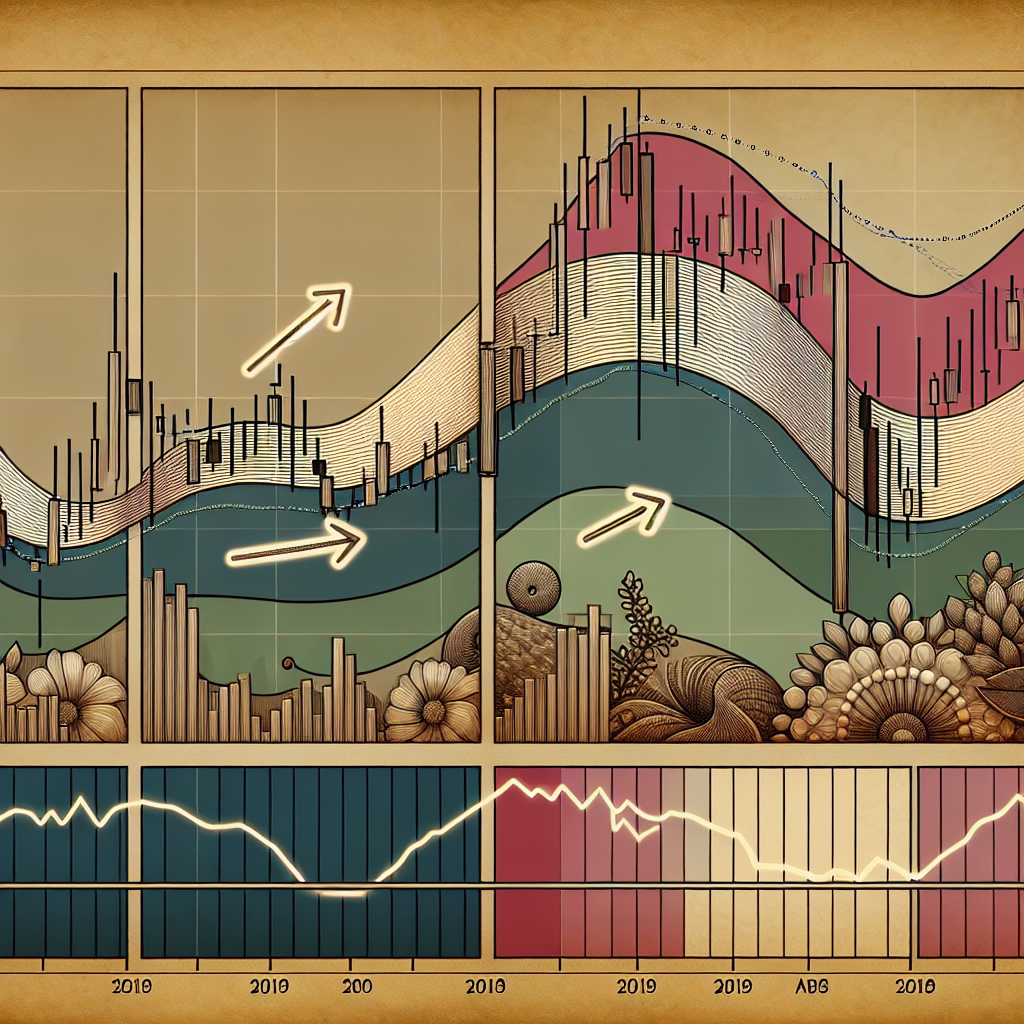
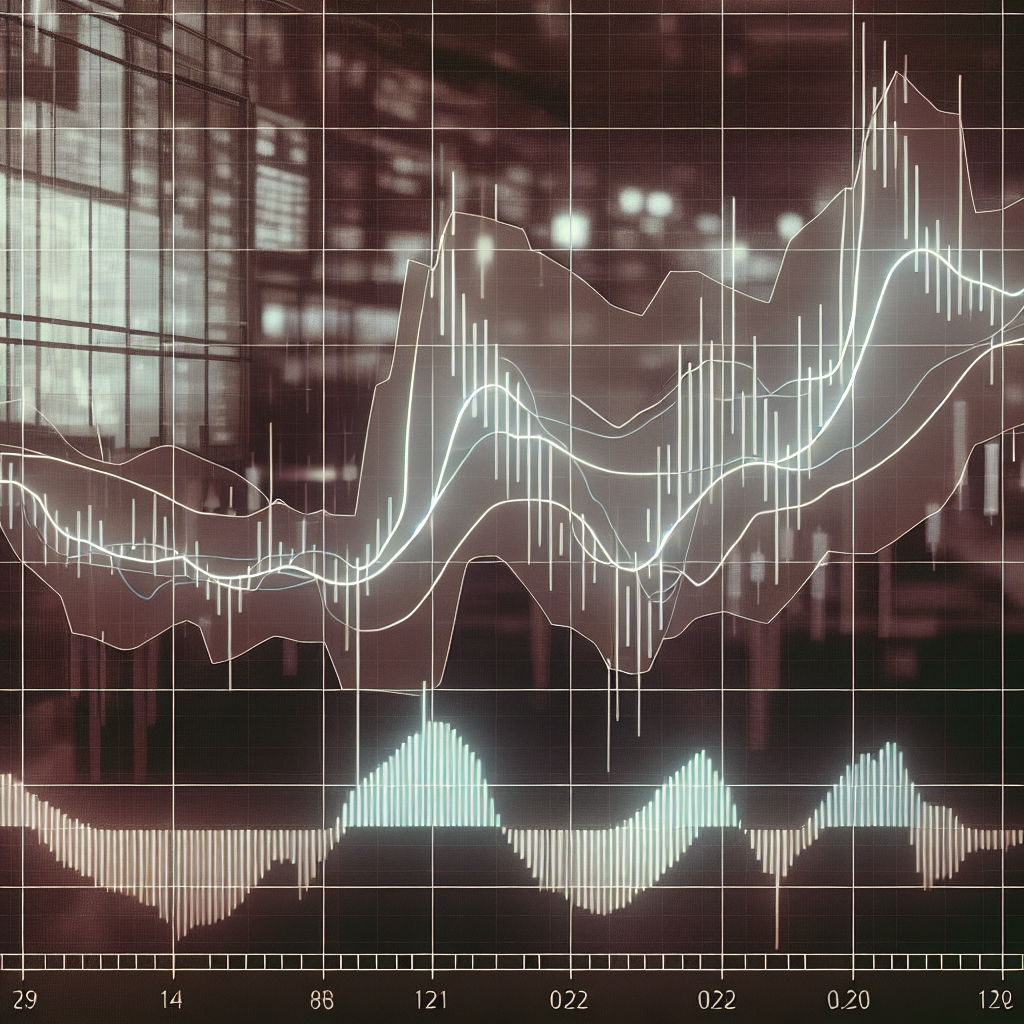
In the world of algorithmic trading, technical indicators play a crucial role. Technical indicators are mathematical calculations, which are plotted as lines on a price chart and can help traders identify certain signals and trends within the market.
How Algorithmic Trading Works
Algorithmic trading uses complex formulas, combined with mathematical models and human oversight, to make decisions to buy or sell financial securities on an exchange. Algorithmic traders often make use of high-frequency trading technology, which can enable a firm to make tens of thousands of trades per second.
Algorithms are programmed to execute trades when certain parameters are met, these parameters could be anything from simple price movements, to more complex factors such as volume and volatility.
Role of Technical Indicators in Algorithmic Trading
Technical indicators are vital tools in algorithmic trading. Most trading algorithms use indicators to better understand market conditions and to guide their trading decisions.
Signal Generation
Technical indicators generate signals that can help identify buying and selling opportunities. For example, a moving average crossover might trigger a buy signal, while an overbought reading on the Relative Strength Index (RSI) might trigger a sell signal.
Market Trends
Indicators can also help identify market trends. For example, a rising moving average indicates an uptrend, while a falling moving average indicates a downtrend.
Volatility
Indicators like the Average True Range (ATR) can measure market volatility. This information can be used to adjust trading strategies, as high volatility often presents more trading opportunities.
Commonly Used Technical Indicators in Algorithmic Trading
There are hundreds of technical indicators available, but some are more popular and commonly used than others. Here are a few examples:
Moving Averages (MA)
Moving Averages smooth out price data to form a trend following indicator. They do not predict price direction, but rather define the current direction with a lag.
Relative Strength Index (RSI)
The Relative Strength Index measures the speed and change of price movements. It is primarily used to attempt to identify overbought or oversold conditions in a market.
MACD – Moving Average Convergence Divergence
MACD is a trend-following momentum indicator, which shows the relationship between two moving averages of a security’s price.
Conclusion
In conclusion, technical indicators play a crucial role in algorithmic trading. They provide signals for entry and exit points, help identify market trends, and measure market volatility. By understanding and using technical indicators effectively, traders can significantly enhance their algorithmic trading strategies.


