Introduction
In the world of finance and investment, risk management is a critical aspect that can determine success or failure. It involves identifying, assessing, and prioritizing potential risks to minimize their impact on investment returns. One of the techniques used in risk management is technical analysis. This method involves using past market data, primarily price and volume, to predict future market trends.
Understanding Technical Analysis
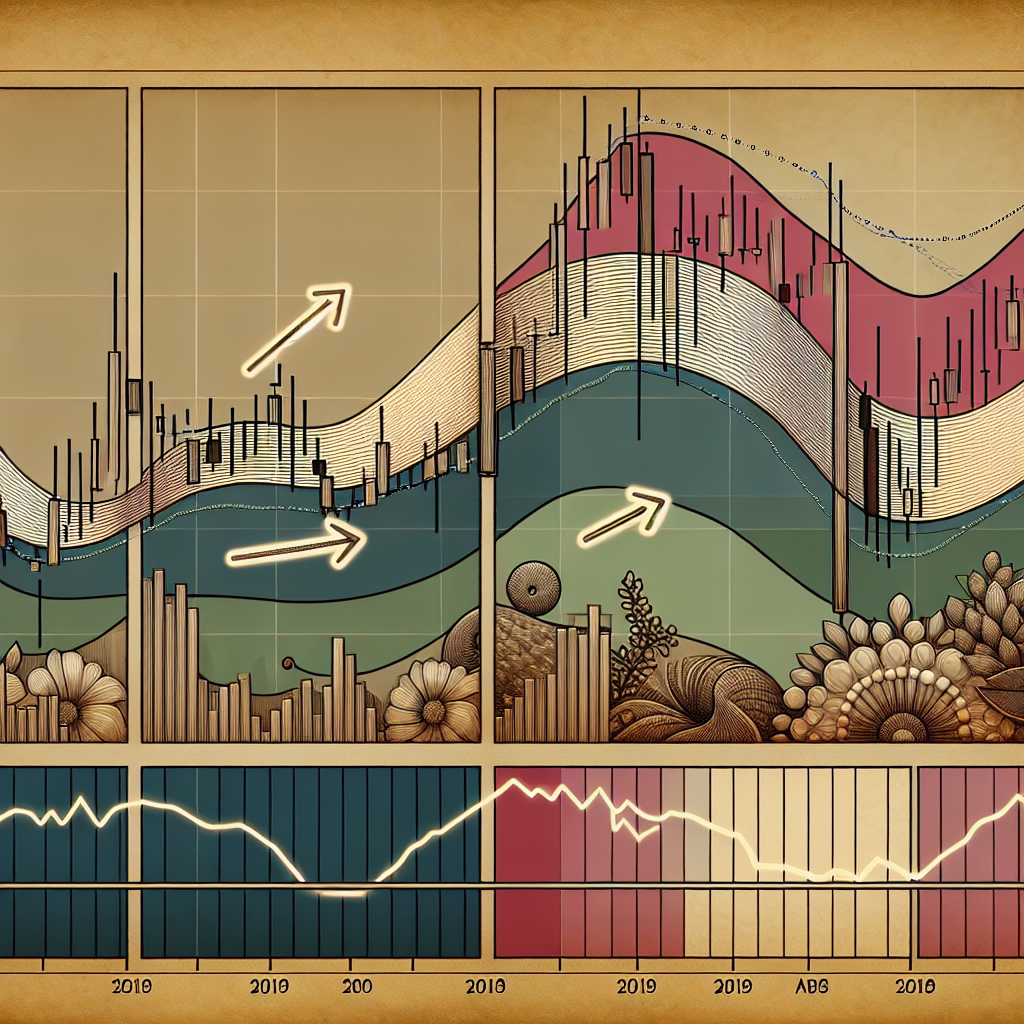
Technical analysis is a trading discipline employed to evaluate investments and identify trading opportunities by analyzing statistical trends gathered from trading activity, such as price movement and volume. Unlike fundamental analysts, who attempt to evaluate a security’s intrinsic value, technical analysts focus on charts of price movement and various analytical tools to evaluate a security’s strength or weakness.
Key Tools of Technical Analysis
– Charts: These are the primary tools for technical analysis. They help traders visualize price movements over specific periods.
– Trend Lines: These are lines drawn over pivot highs or under pivot lows to show the prevailing direction of price.
– Support and Resistance: These are specific price points on a chart that potentially limit further price movements.
– Moving Averages: These are calculations that smooth out price data by creating a constantly updated average price.
Applying Technical Analysis for Risk Management
Technical analysis can be a powerful tool for managing risk in your investment portfolio. Here’s how you can use it:
Identifying Market Trends
Technical analysis can help you identify market trends, whether upward, downward, or sideways. By understanding these trends, you can make informed investment decisions and manage risk effectively. For instance, in an upward trend, you might want to increase your investment in a particular asset, while in a downward trend, you might want to reduce your investment or exit the market.
Establishing Entry and Exit Points
Technical analysis can also help you identify the best times to enter or exit a trade, which is crucial in risk management. For example, support and resistance levels can act as signals for entry and exit points. When the price of an asset approaches a support level, it could be a good time to buy as the price is likely to rebound upwards. Conversely, when the price approaches a resistance level, it could be a good time to sell as the price is likely to fall.
Setting Stop Loss Orders
Stop loss orders are an essential risk management tool, and technical analysis can help you set them effectively. A stop loss order is an order placed with a broker to buy or sell a security when it reaches a certain price. By using technical analysis, you can determine the price at which you should set your stop loss order to limit your loss if the market moves against you.
Conclusion
Risk management using technical analysis is a crucial aspect of successful trading and investing. By understanding market trends, establishing entry and exit points, and setting stop loss orders, you can manage risk effectively and increase your chances of achieving your investment goals. Remember, while technical analysis can be a powerful tool, it’s not foolproof, and it should be used in conjunction with other risk management strategies and tools.


