Introduction to Advanced Ichimoku Cloud Strategies
Ichimoku Cloud, also known as Ichimoku Kinko Hyo, is a versatile indicator that defines support and resistance, identifies trend direction, gauges momentum, and provides trading signals. The Ichimoku Cloud is a comprehensive indicator, providing more data points than the standard candlestick chart. Although it may appear complex for beginners, it’s incredibly useful once you understand its components and how to interpret them. This article will focus on advanced Ichimoku Cloud strategies that can help traders to make informed decisions.
The Basics of Ichimoku Cloud
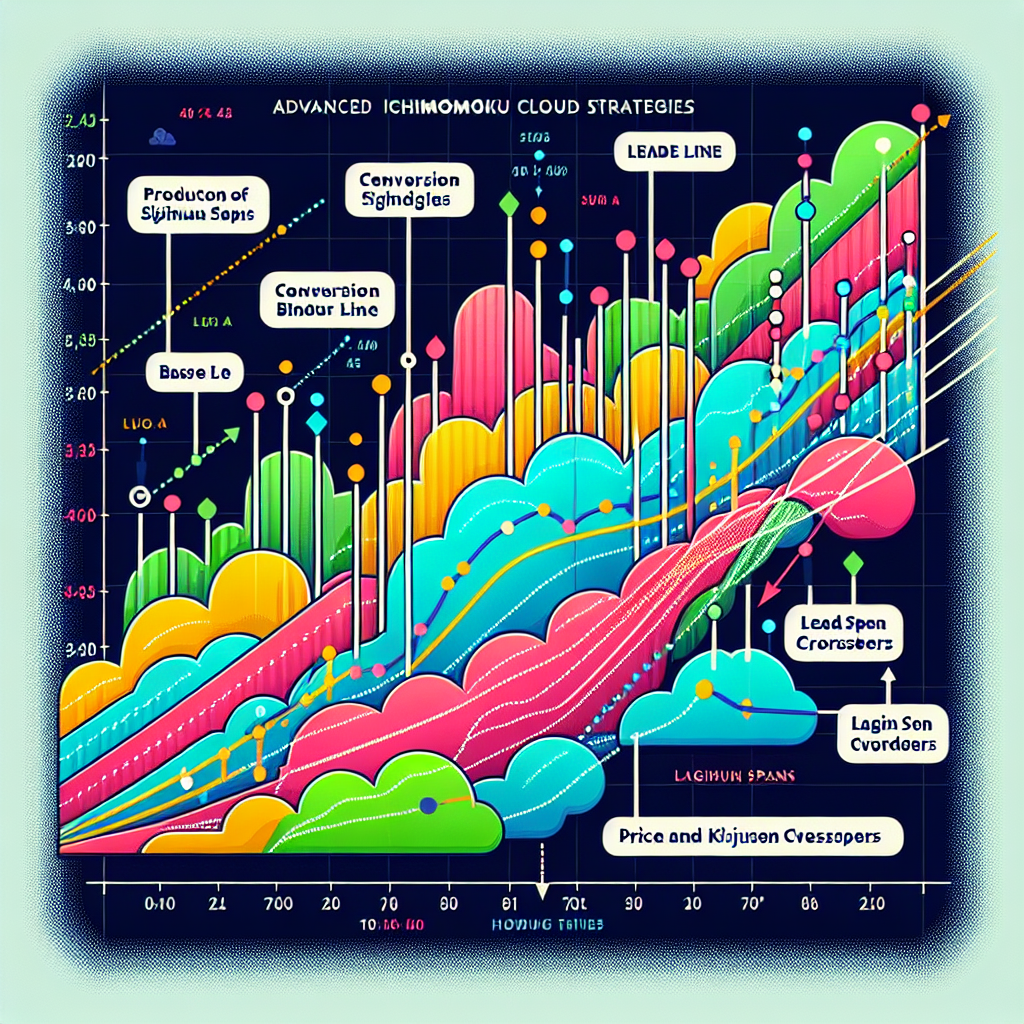
Before delving into advanced strategies, it’s crucial to understand the basic components of the Ichimoku Cloud. It consists of five lines, including the Tenkan-Sen (Conversion Line), Kijun-Sen (Base Line), Senkou Span A (Leading Span A), Senkou Span B (Leading Span B), and Chikou Span (Lagging Span).
Tenkan-Sen (Conversion Line)
This line is calculated by averaging the highest high and the lowest low for the past nine periods.
Kijun-Sen (Base Line)
This line is calculated by averaging the highest high and the lowest low for the past 26 periods.
Senkou Span A (Leading Span A)
This line is the average of the Conversion Line and the Base Line. The value is plotted 26 periods ahead of the current price.
Senkou Span B (Leading Span B)
This line is calculated by averaging the highest high and the lowest low for the past 52 periods. The value is plotted 26 periods ahead of the current price.
Chikou Span (Lagging Span)
This line is the closing price plotted 26 periods behind the current price.
The space between the Senkou Span A and B forms the “cloud,” which can be shaded or colored for visual effect.
Advanced Ichimoku Cloud Strategies
1. The Breakout Strategy
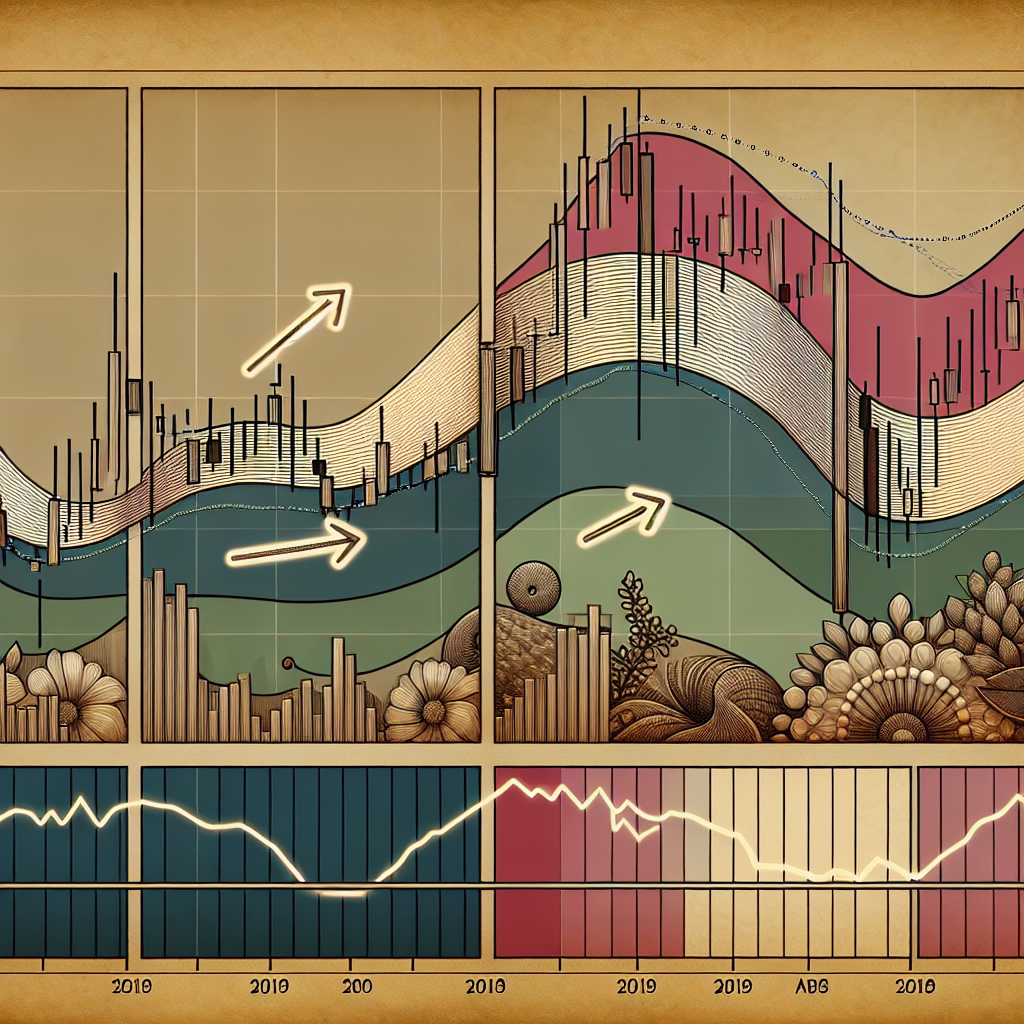
One of the most common advanced Ichimoku strategies is the breakout strategy. This involves waiting for the price to break through the cloud, which is often a signal of a strong trend. If the price breaks through the cloud from below, it’s a bullish signal, and if it breaks from above, it’s a bearish signal.
2. The Kumo Twist Strategy
The Kumo twist occurs when Senkou Span A and Senkou Span B cross each other. If Span A moves above Span B, it’s a bullish signal, and if Span A moves below Span B, it’s a bearish signal. This strategy is used to predict future shifts in the market trend.
3. The TK Cross Strategy
The TK Cross strategy involves the Tenkan-Sen (Conversion Line) and the Kijun-Sen (Base Line). A bullish signal is given when the Tenkan-Sen crosses above the Kijun-Sen, and a bearish signal is given when it crosses below. This strategy is often used in conjunction with the cloud. For instance, if the TK cross happens above the cloud, it provides a stronger bullish signal.
4. The Price and Cloud Strategy
In this strategy, traders look at the price in relation to the cloud. If the price is above the cloud, the overall trend is bullish, and if it’s below the cloud, the trend is bearish. This strategy can help determine the overall trend direction and find potential reversal points.
Conclusion
The Ichimoku Cloud is a powerful tool that can provide a wealth of information about market trends. By understanding and applying these advanced strategies, traders can make more informed decisions and potentially increase their profits. However, like all trading strategies, these should be used in conjunction with other tools and analysis methods to maximize their effectiveness.


