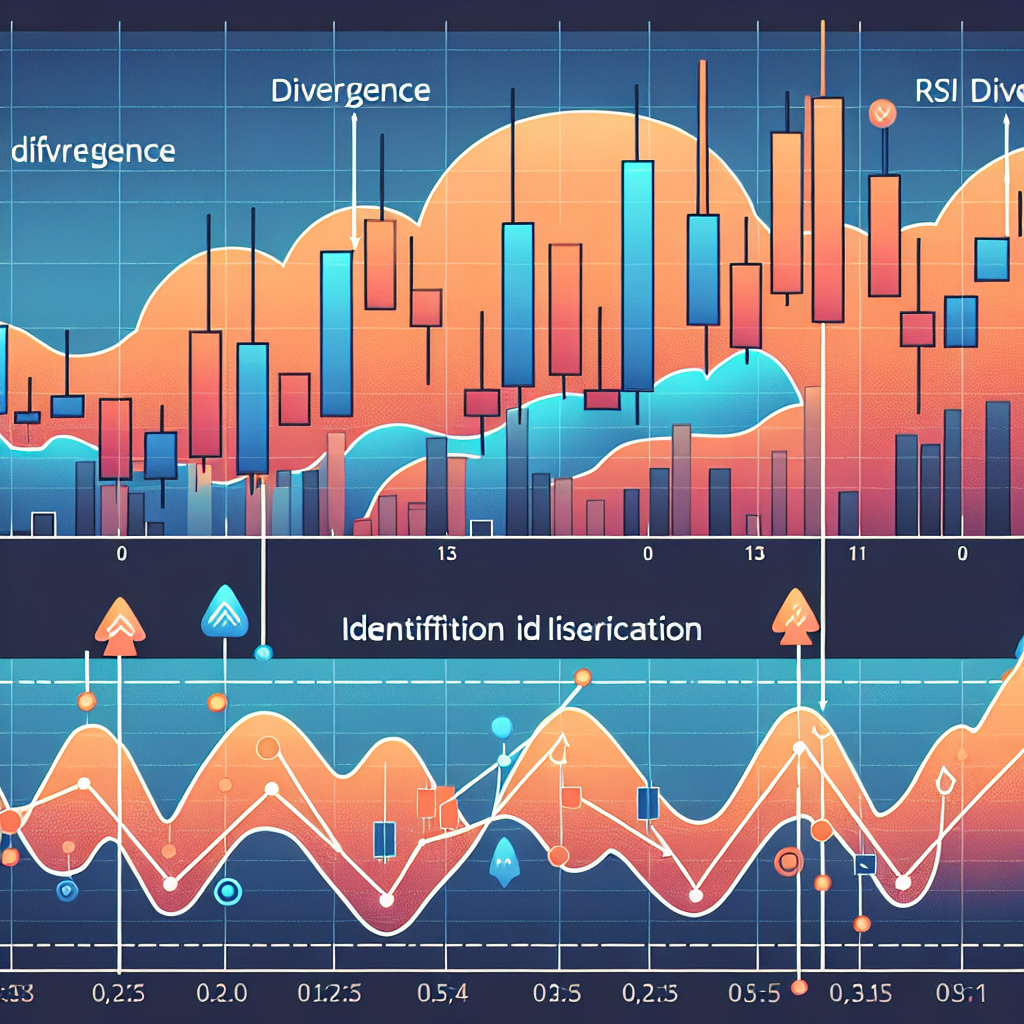
Identifying RSI Divergence
The Relative Strength Index (RSI) is a popular tool among traders and investors for gaiving insights into an asset’s current and potential future price movements. One of the most effective ways to use RSI is by identifying divergences. In this article, we’ll delve into what RSI divergence is, how it can be identified, and how it can be used to make informed trading decisions.
Understanding RSI
Before we dive into RSI divergence, it’s essential to understand what RSI is. The Relative Strength Index (RSI) is a momentum oscillator that measures the speed and change of price movements. It’s typically used to identify overbought or oversold conditions in a market.
The RSI is displayed as an oscillator (a line graph that moves between two extremes) and can have a reading from 0 to 100. Generally, an asset is considered overbought when the RSI is above 70 and oversold when it’s below 30.
What is RSI Divergence?
RSI divergence occurs when the price of an asset is moving in the opposite direction of the RSI. This can be a powerful signal that the current trend may be weakening or about to reverse.
There are two types of RSI divergence:
Bullish Divergence
This occurs when the price of an asset is making lower lows while the RSI is making higher lows. This divergence can often be a sign that the downward trend is losing momentum and a potential upward trend could be on the horizon.
Bearish Divergence
This happens when the price of an asset is making higher highs while the RSI is making lower highs. This divergence can often indicate that the upward trend is losing momentum and a potential downward trend could be coming.
Identifying RSI Divergence
Identifying RSI divergence involves closely observing both the price movement of an asset and the movement of the RSI. Here’s how you can do it:
Step 1: Observe the Price Action
The first step in identifying RSI divergence is to observe the price action of the asset. Look for a series of higher highs or lower lows in the price.
Step 2: Compare with the RSI
Next, compare the price action with the movement of the RSI. If the price is making higher highs while the RSI is making lower highs, this is a bearish divergence. If the price is making lower lows while the RSI is making higher lows, this is a bullish divergence.
Step 3: Look for Confirmation
RSI divergence isn’t a guarantee that a trend reversal will happen. Therefore, it’s important to look for other indicators or confirmation before making a trading decision.
Conclusion
RSI divergence can be a powerful tool in predicting potential trend reversals. However, like all trading indicators, it’s not foolproof and should be used in conjunction with other analysis methods and tools. By understanding how to identify RSI divergence, traders can make more informed decisions and potentially improve their trading outcomes.


